Institutional report
The Rail Is the Product
Tokenised cash funds and their traditional comparators sit under two different disclosure regimes, so the most natural question an allocator can ask has no common basis on which to be answered. This report sets out where the product belongs, what can be established about it, and what cannot.
Three Horizons Capital | 20 August 2026 | Fund data read 19 August 2026, tokenised figures re-confirmed 20 August | For professional and qualified investors | No individual fund, provider or issuer is named
$16.19bn
the whole tokenised cash segment, across 87 products, roughly double where it stood a year ago
$158.7m
three on-chain funds resolve directly in our own fund database, which is where our coverage line actually sits
9bp
the entire fee spread across the six largest incumbent vehicles, and the yardstick every tokenised fee is held against
In 2026 the tokenised cash fund stopped being a pilot. So the question arrives at the allocator in a familiar form. Here is a fund that holds the same Treasury bills you already own, on a settlement rail that runs continuously. It costs a little more. Should you switch?
It is a reasonable question and it is very hard to answer honestly, because the two sides of the comparison are not measured the same way. One side publishes a standardised thirty-day yield computed under a regulator's formula. The other publishes a seven-day annualised rate set by its sponsor. One discloses a total expense ratio. The other discloses a management fee that is currently subsidised, with custody and network costs sitting outside it.
The difficulty, stated plainly
None of this is concealment. All of it is disclosed. And it means the most natural question an allocator can ask, is this cheaper than what I already hold, has no common basis on which to be answered. Which is a reason to change the question rather than to keep asking it.
Price it as a liquidity instrument, not as a yield instrument
A listed cash fund is a yield instrument. It is held to earn the bill rate at the lowest available cost, so every basis point of fee is a direct deduction from the only thing it exists to produce. Judged on that basis, dearer is simply worse.
A tokenised cash fund does a different job. It is held so that a position can be moved or pledged at a moment when the banking and wire rails are closed. That capability is not measured in yield, and its fee is not a deduction from yield. It is the price of the capability.
Our view
This belongs in the treasury and collateral sleeve, budgeted against settlement risk, and sized to the cash that has to move on a closed day. It does not belong in a yield comparison, and the industry practice of putting it there is what makes the product look both overpriced and overhyped at the same time. JUDGEMENT
The incumbent shelf is large, and it prices inside nine basis points
Across US cash and ultra-short strategies our fund database resolves 164 funds holding $686.3bn, counted at strategy level rather than share-class level. The six largest US-listed exchange-traded vehicles price as follows. OURS
| Vehicle | Assets | Expense ratio |
|---|---|---|
| 0 to 3 month Treasury bill fund | $103.21bn | 0.09% |
| 1 to 3 month Treasury bill fund | $46.71bn | 0.14% |
| Ultra-short active income fund | $40.60bn | 0.18% |
| 1 to 3 year Treasury fund | $25.34bn | 0.15% |
| 0 to 1 year Treasury fund | $20.65bn | 0.15% |
| Floating-rate Treasury fund | $18.73bn | 0.15% |
Our fund database, read 19 August 2026, collapsed to fund level. Ranked by assets across US-domiciled exchange-traded vehicles in the three cash-like categories. Expense ratios are unioned across both fee tables, because one carries exchange-traded wrappers and the other carries open-end wrappers.
Against $686.3bn, the entire tokenised Treasury and money market segment stands at $16.19bn across 87 products on the category aggregator's 19 August read. EXTERNAL A single incumbent fund is still more than six times the whole segment, and the segment is roughly double where it stood a year ago.
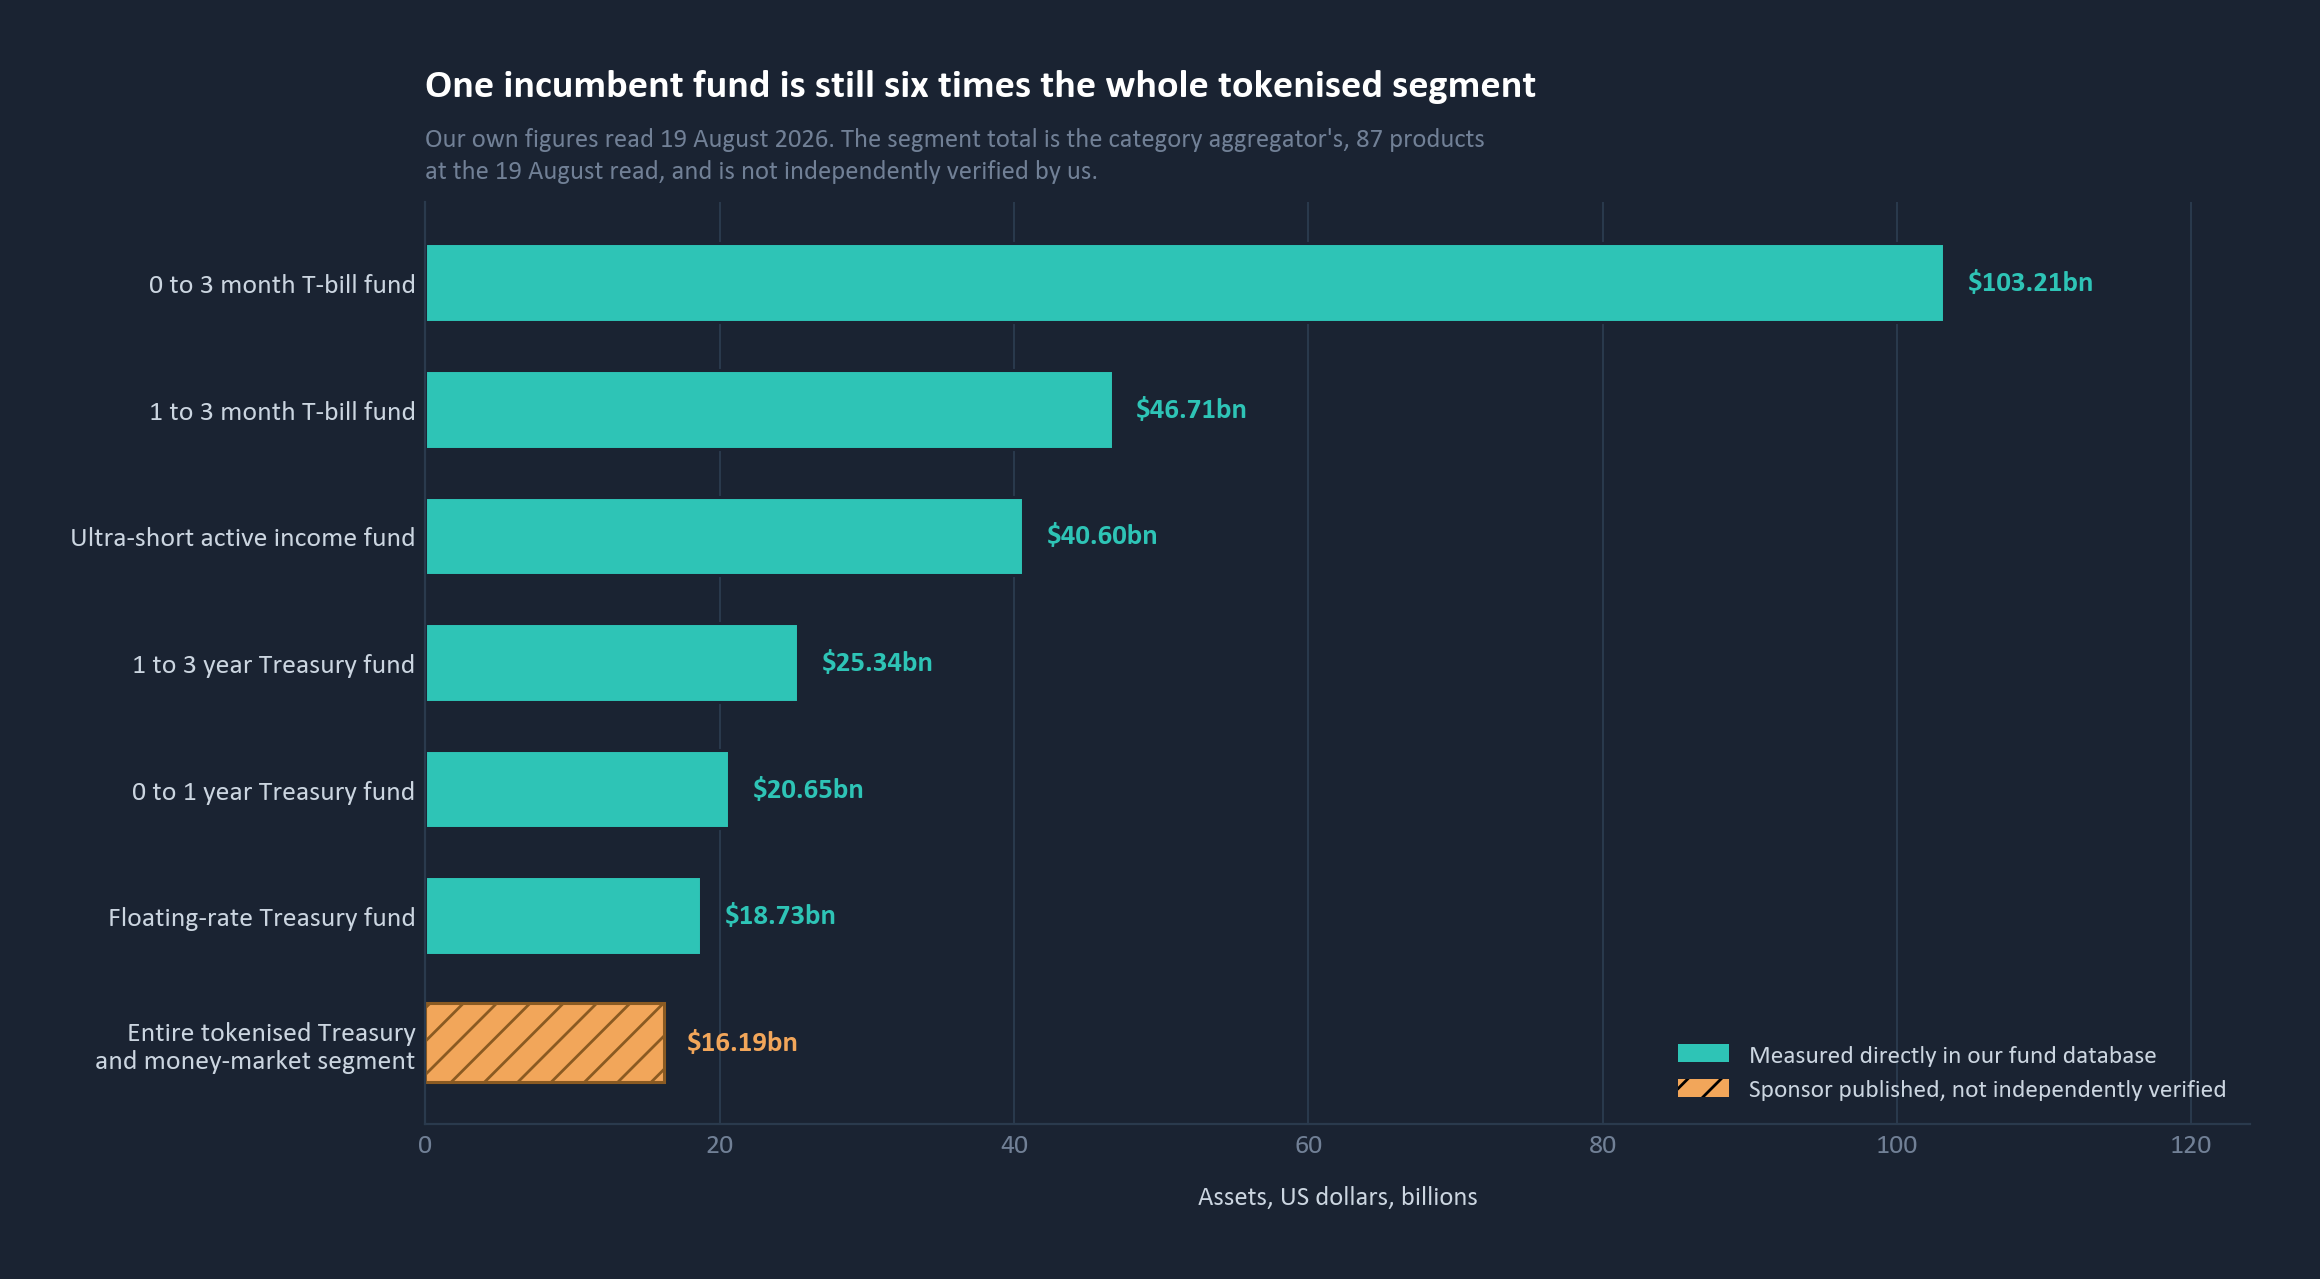
The less obvious point is the fee column. The six largest incumbents price between 0.09% and 0.18%, a spread of nine basis points. OURS Against that, the tokenised side spans a management fee of roughly fifteen to fifty basis points across the category. EXTERNAL
So what
The premium is not a number. Take the cheapest tokenised fee against the median incumbent and it is nothing at all. Take the dearest against the cheapest incumbent and it is more than forty basis points. Our own all-in build-up, on the vehicles we examined and with custody and network costs separated out, lands at five to thirty. All three are defensible. They answer different questions, and a premium that swings this far cannot be the basis of the decision. Price is the wrong axis.
The comparison has to be built, and that is where the work is
Three load-bearing figures in our own first assembly of this comparison were wrong. Each was corrected by checking it against something, and the size of the corrections is the finding.
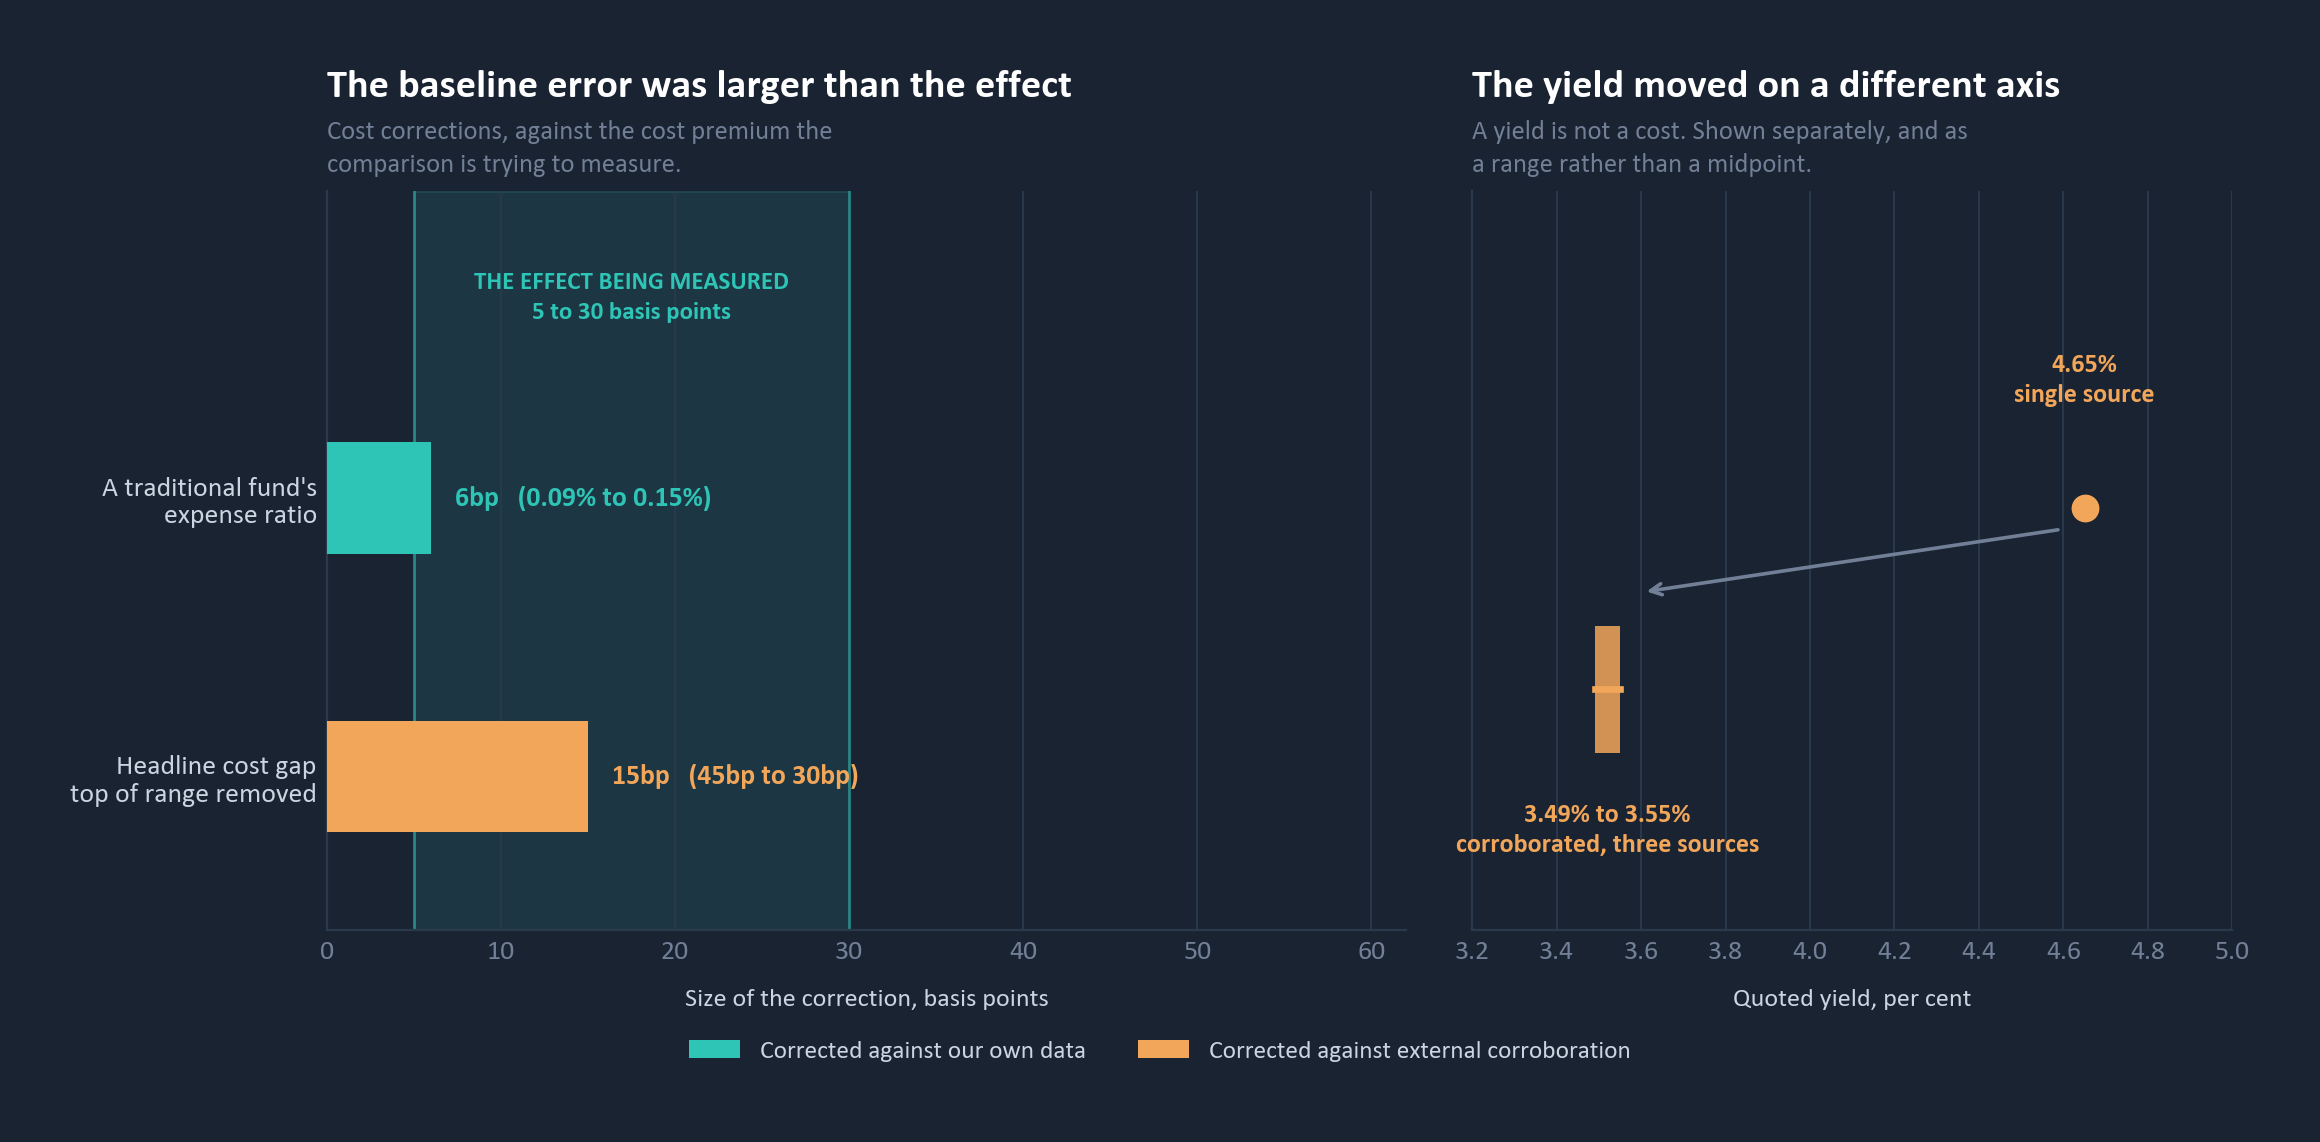
A traditional fund's expense ratio, carried as an external estimate at 0.09%, is 0.15% in our own data. OURS The estimate had applied the 0 to 3 month fund's fee to the 0 to 1 year fund. Six basis points, against an effect being measured of five to thirty. At the tight end the baseline error was larger than the entire effect.
A tokenised fund's yield, reported once at 4.65%, corroborated at 3.49% to 3.55% across three independent sources, and reads 3.40% on the category aggregator today. EXTERNAL Cash yields move. A figure of this kind has a shelf life measured in days, and any comparison built on one has to carry its date.
The mechanism
The comparison is not hard because the technology is new. It is hard because the two sides answer to different disclosure regimes, and neither regime publishes the translation to the other.
This is the fourth time this year we have found the same failure mode in a different market. A flow score measuring the pace of buying, read as its direction. A fund distribution rate measuring cash sent, read as income earned. A fee field populated for one wrapper type, compared against another. And now a sponsor's seven-day rate, read as a standardised yield. JUDGEMENT Every one of those figures was correct. Every one answered a narrower question than the one being asked of it.
The reference layer has not decided what these products are
Our fund database resolves three on-chain Treasury and liquidity funds directly. OURS
| Vehicle | Domicile | Assets |
|---|---|---|
| Treasury digital fund, on-chain | United States | $76.8m |
| On-chain government liquidity fund | Luxembourg | $56.9m |
| On-chain liquidity fund | United States | $25.0m |
| Combined | $158.7m |
Our fund database, all three read 19 August 2026 at fund level.
The naming and the structure disagree
One of the three is named as a share class, carrying a class designation and a distribution suffix in its legal name. In the database it is modelled as its own separate portfolio, with no parent fund and no sibling classes. The same is true of the other two.
That matters because the industry is describing this wave in both languages at once. Some launches are announced as tokenised share classes of existing funds, which would let them inherit an incumbent's assets, track record and distribution from day one. Others are standalone products starting from nothing. Those two paths have completely different economics, and the reference data currently records them the same way. JUDGEMENT
The identifiers are already colliding
One ticker widely cited in coverage of tokenised Treasury funds resolves, in our database, to an unrelated listed short-term bond exchange-traded fund holding $2.49bn. OURS Two different products, one symbol, at opposite ends of the size range. Anyone screening that ticker in a commercial system receives a clean-looking answer about the wrong fund.
So what
We published a near-identical collision a fortnight ago, in a physical gold fund whose ticker was shared with an unrelated European miners vehicle. Twice in two reports is not a coincidence. Reference data is thinnest at a market's newest edge, precisely where the products are least familiar and the checking is hardest. How this segment gets classified is being written right now, and the structure a manager chooses at launch determines how the product is recorded, screened and found for years afterwards.
What the rail buys, and how to size it
On the static comparison the traditional vehicle wins. It is cheaper, deeper, discloses more, and its yield is computed under a formula an allocator can verify. On a buy-and-hold cash allocation with no intraday requirement there is no return argument for the tokenised version.
What it buys is settlement. For a Gulf-based holder of US dollar cash, local markets trade Sunday to Thursday and US banking and wire rails run Monday to Friday. Three days a week at most one of the two is open. The cost is not the whole three days but the cutoff: an instruction that misses the local Thursday cutoff cannot be raised at home until Sunday, and one that misses the US Friday cutoff cannot settle until Monday.
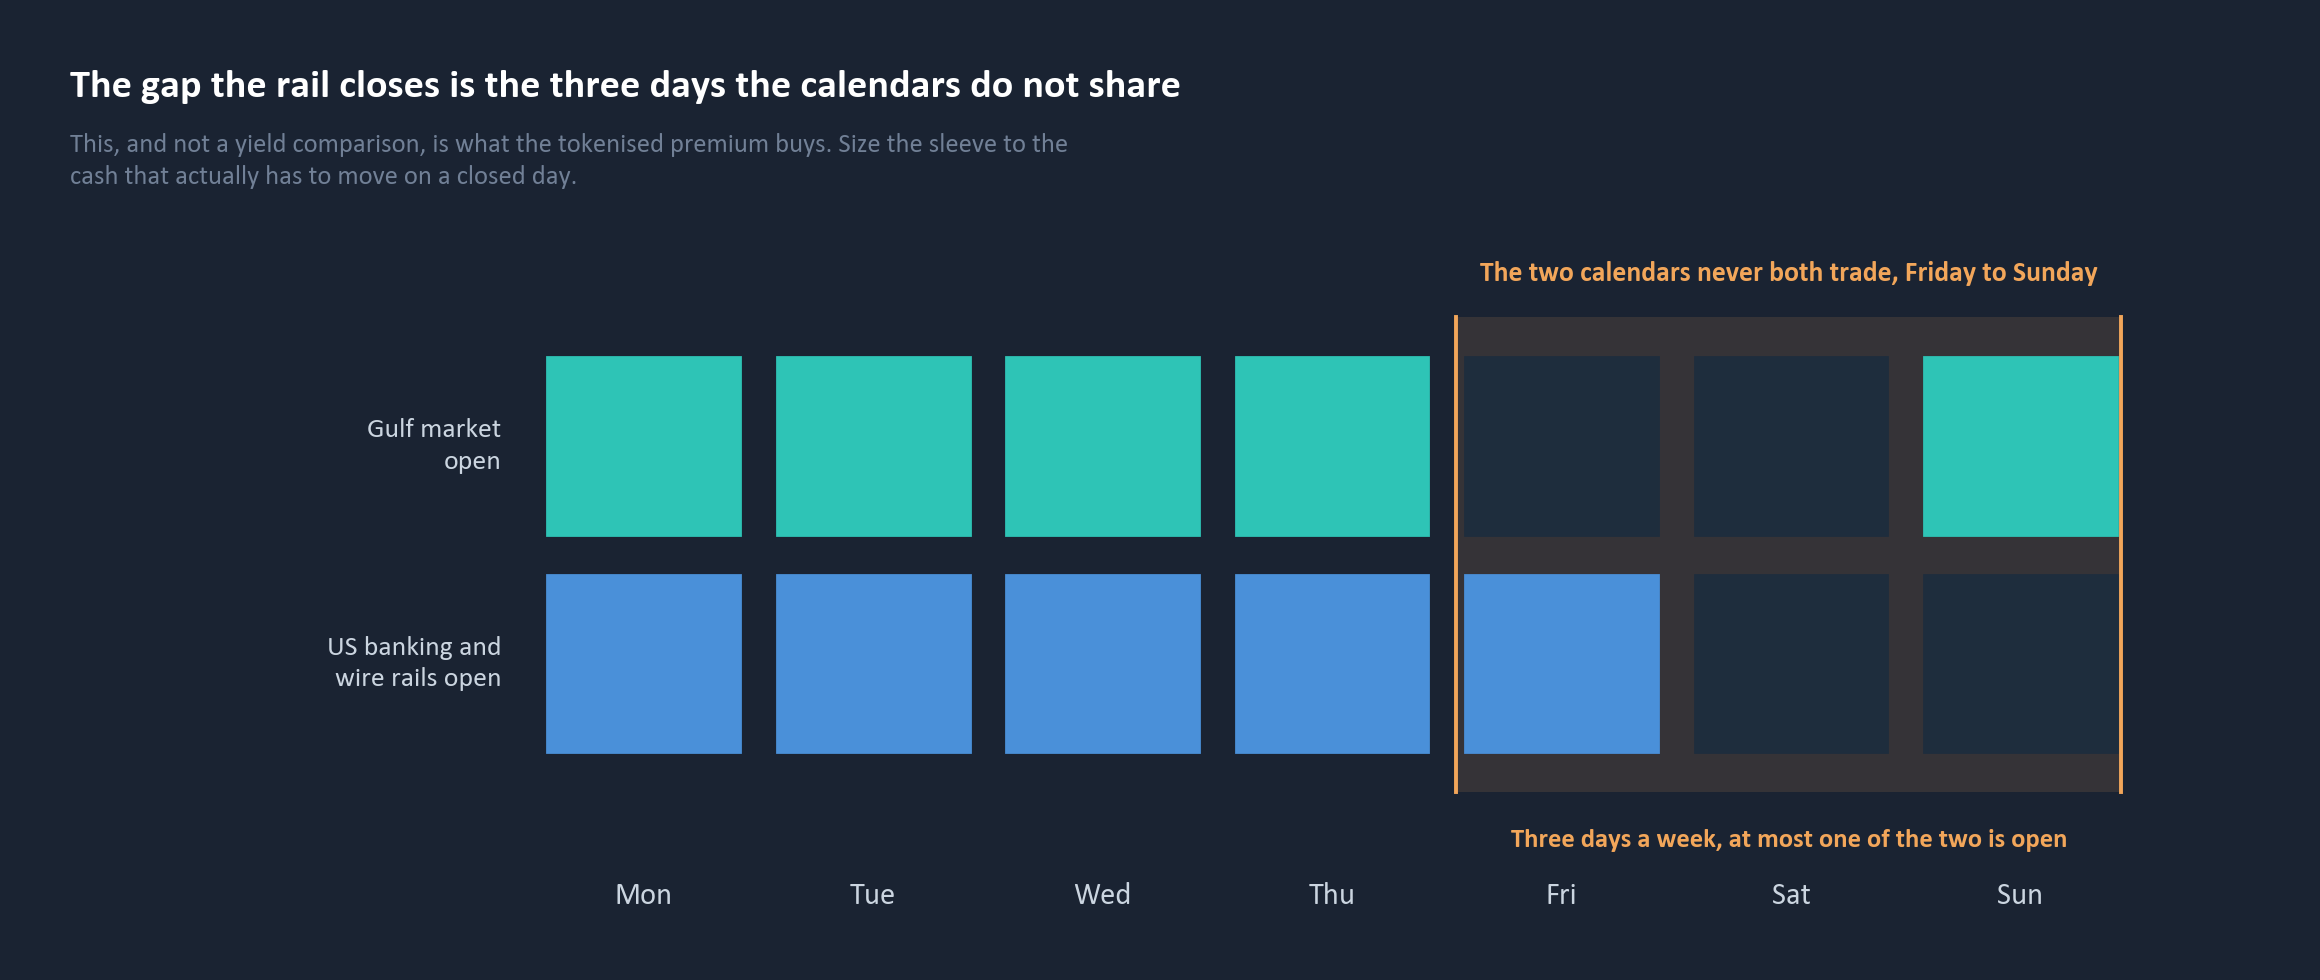
If the alternative to a settlement gap is an emergency bridge facility or an over-collateralised margin draw, the implied cost of the gap runs to several hundred basis points annualised on a short-dated borrowing. JUDGEMENT Against that, a premium of at most a few tens of basis points on the sleeve that needs to move is inexpensive, wherever in the range it falls.
So what
Pay the premium on the portion of the liquidity book that has to be able to move on a closed day, and hold the rest in the cheaper, deeper traditional vehicle. The sizing question, and not the yield comparison, is the whole decision.
What this report does not contain
Every tokenised figure here is external. Each is sponsor or aggregator published, carries a date between March and August 2026, and is not independently verified by us. We hold no proprietary return, flow or holdings series for these funds, which is why no performance comparison appears anywhere in this report.
We cannot price the settlement optionality in a stress event. That requires data on actual weekend liquidity events, which we do not hold. The sizing rule is offered as a method rather than as a number.
The scale comparison pairs two provenances. It places our directly measured fund figures against a category aggregator's segment total. Both carry the same date, and the segment total is the aggregator's count across 87 products rather than anything we hold.
This is scoped to what we examined. Where we describe what a set of funds does or does not offer, that description covers the funds reviewed here at the date shown, and is not a statement about the market as a whole. Tokenised private-credit pools sit at a different point on the risk curve and belong in a different report. Which ledger a fund settles on is not an allocator's decision variable and does not appear in this analysis.
No credit-spread context. Material that appeared in an internal draft of this work could not be re-derived at the date of writing and was removed rather than carried forward.
Three questions to put to anyone showing you one of these.
What is the yield figure, and under whose formula? A seven-day annualised sponsor rate and a standardised thirty-day yield are both correct and are not comparable. Is the fee subsidised, and what sits outside it? Custody, network costs and onboarding are frequently disclosed separately or not at all. Is this a new fund, or a new version of an existing one? If it is a share class of a fund with a record, that record is available to you. Then the question that requires a view: what proportion of this liquidity book has to be able to move on a day the banks are shut. That number is the size of the tokenised sleeve. Send us the fact sheet and we will run the three checks with you.
Important information
Publisher and purpose. This material is published by Three Horizons Capital as part of its Intelligence Series. It is provided for general information and educational purposes only and reflects our views as of the date of publication, which are subject to change without notice. We are under no obligation to update it.
Not advice, not a recommendation, not an offer. Nothing in this material constitutes, or should be construed as, investment, legal, tax, accounting or other advice, a research recommendation, or an offer, invitation or solicitation to buy, sell, subscribe for or transact in any security, fund, commodity or strategy. It is not a personal recommendation and does not take account of the objectives, financial situation, knowledge, experience or needs of any person. Three Horizons Capital is not a regulated entity.
No products, issuers, funds or providers are named. By editorial decision, no individual fund, provider, issuer or ticker is identified anywhere in this material.
Scope and basis of our own figures. Fund counts, fund sizes, expense ratios and the on-chain fund coverage set are derived from the Three Horizons Capital data platform, read on 19 August 2026. Figures are US-domiciled unless stated, collapsed from share-class records to fund level, and expense ratios are unioned across both fee tables because one carries exchange-traded wrappers and the other carries open-end wrappers. Morningstar category is used as the classification construct.
Sponsor and aggregator figures. All figures describing tokenised products, including segment size, quoted yields and fee levels, are sponsor or aggregator published, carry dates between March and August 2026, and are not independently verified by us. The segment total and the quoted yield were re-confirmed on 20 August 2026. Cash yields move within days and should be re-confirmed against current sources before any client use.
Corrections to earlier drafts, disclosed. A draft of 17 August carried an incumbent table headed as the six largest vehicles which was not: three larger funds were missing. It was rebuilt on 19 August from the stated rule printed beneath the table, and the table in this report is that rebuilt version. Drafts of 17 and 19 August put the tokenised segment at five to six billion dollars, assembled from four sponsors and two aggregators on mixed dates. Re-confirmed on 20 August 2026, the figure is $16.19bn. Both corrections are the reason this report dates every figure at the point of use.