Institutional report
Off the Shelf
What to establish before you compare a listed product. Three checks that now sit inside the shelf screen, worked through one fully-disclosed product: what it holds, which of its yield figures is a standardised measure, and what its fee actually compares to.
Three Horizons Capital | 20 August 2026 | Fund data as at 19 August 2026 | For professional and qualified investors | No individual fund, provider or issuer is named
3 yields
published for one fund, measuring three different things. Only one of them can be a replication target
45bp
overlay fee premium over plain equity beta on a consistent wrapper basis, against 24bp if the wrappers are mixed
3 legs
of options sit under a product whose name describes a single metal, and every one of them is disclosed
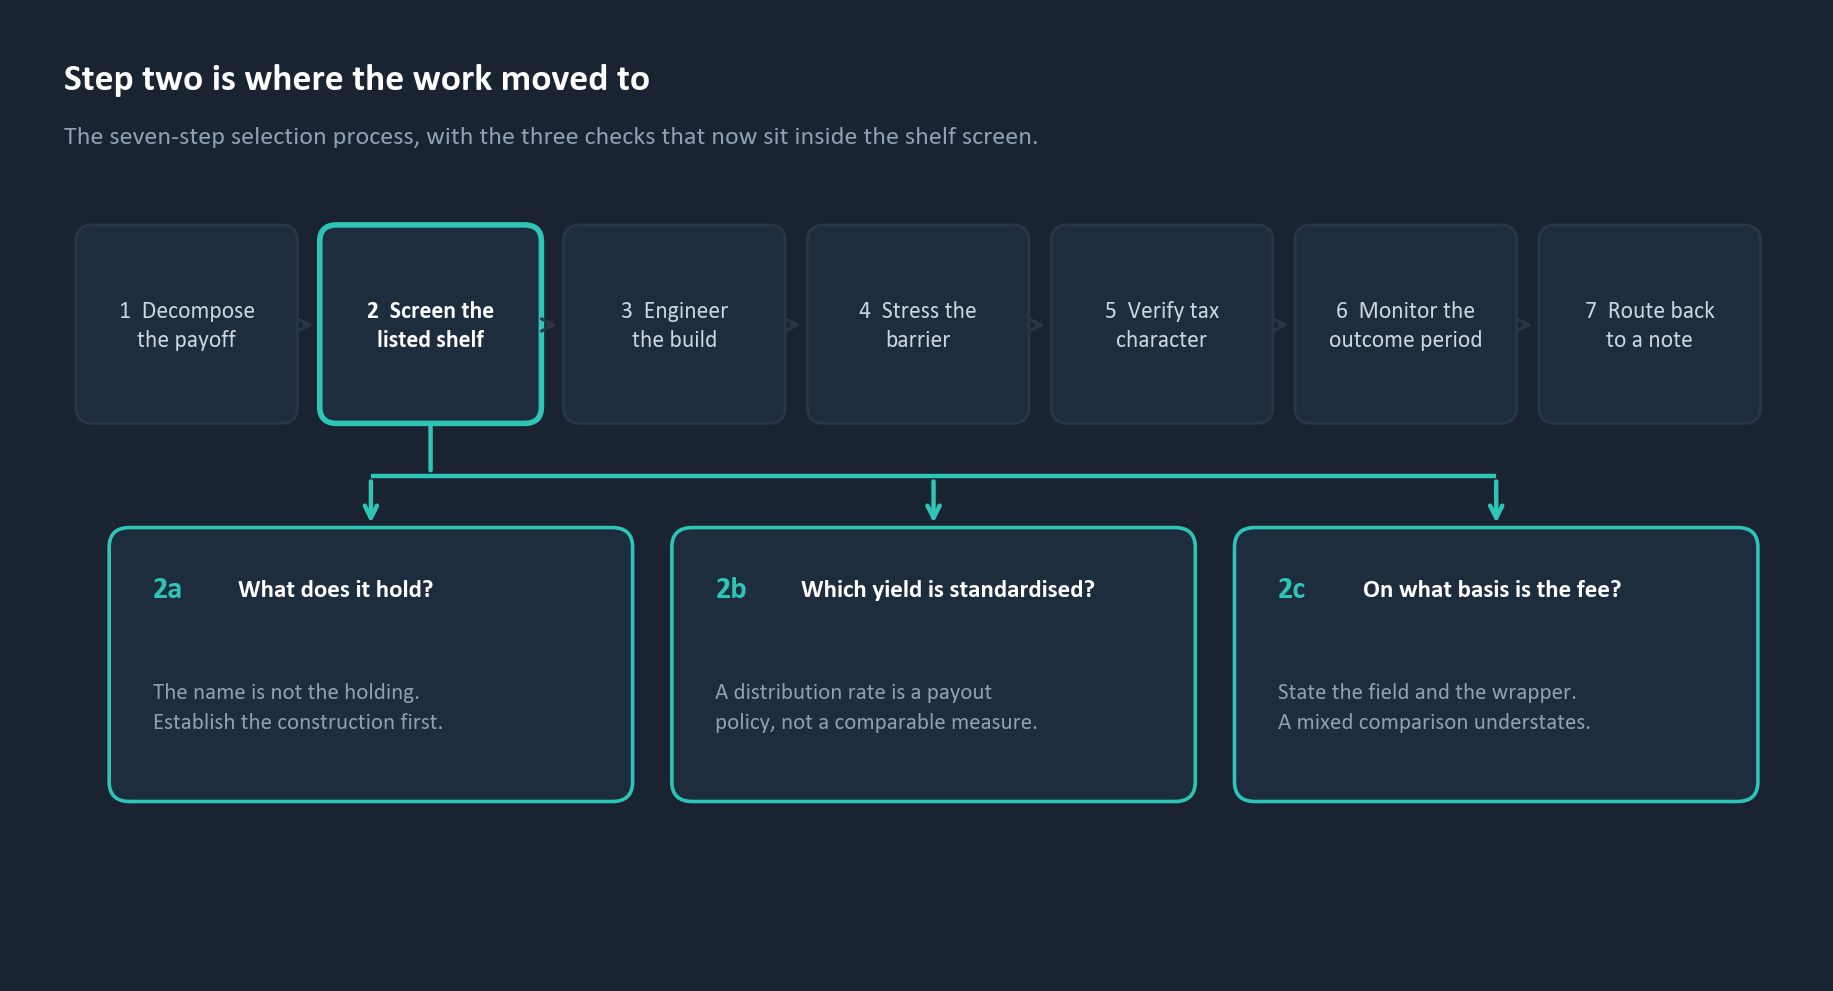
On 12 August we published the order of operations for choosing a structured product: name the payoff shape, choose the wrapper, then screen the listed shelf before accepting that anything bespoke is necessary. We described that shelf screen as a gate. Run it on a real product and it is not a gate. It is where the work moved to.
The seven steps, as published
Step two is the one this report expands. The process in full is at How to Choose a Structured Product.
What prompted it
An adviser was shown a newly launched gold income fund and asked whether a client should buy it or build the same exposure more cheaply. The fund itself is a private-placement vehicle we hold no data on, so the work runs on the public listed comparable operating the same strategy. Every figure below can be checked independently.
Two of the four listed-route advantages survive intact
The earlier report gave the listed route four advantages over a bank note: no issuer-credit line item, daily liquidity, disclosed holdings, and a fee under one per cent. Two hold exactly. The option legs are exchange-cleared and the collateral is Treasury bills, so no bank balance sheet stands behind the payoff, and daily liquidity holds. The other two hold as written and mislead as used, and a fifth dimension the earlier report had no reason to examine turned out to matter most.
Disclosed holdings is true. What is disclosed is not gold.
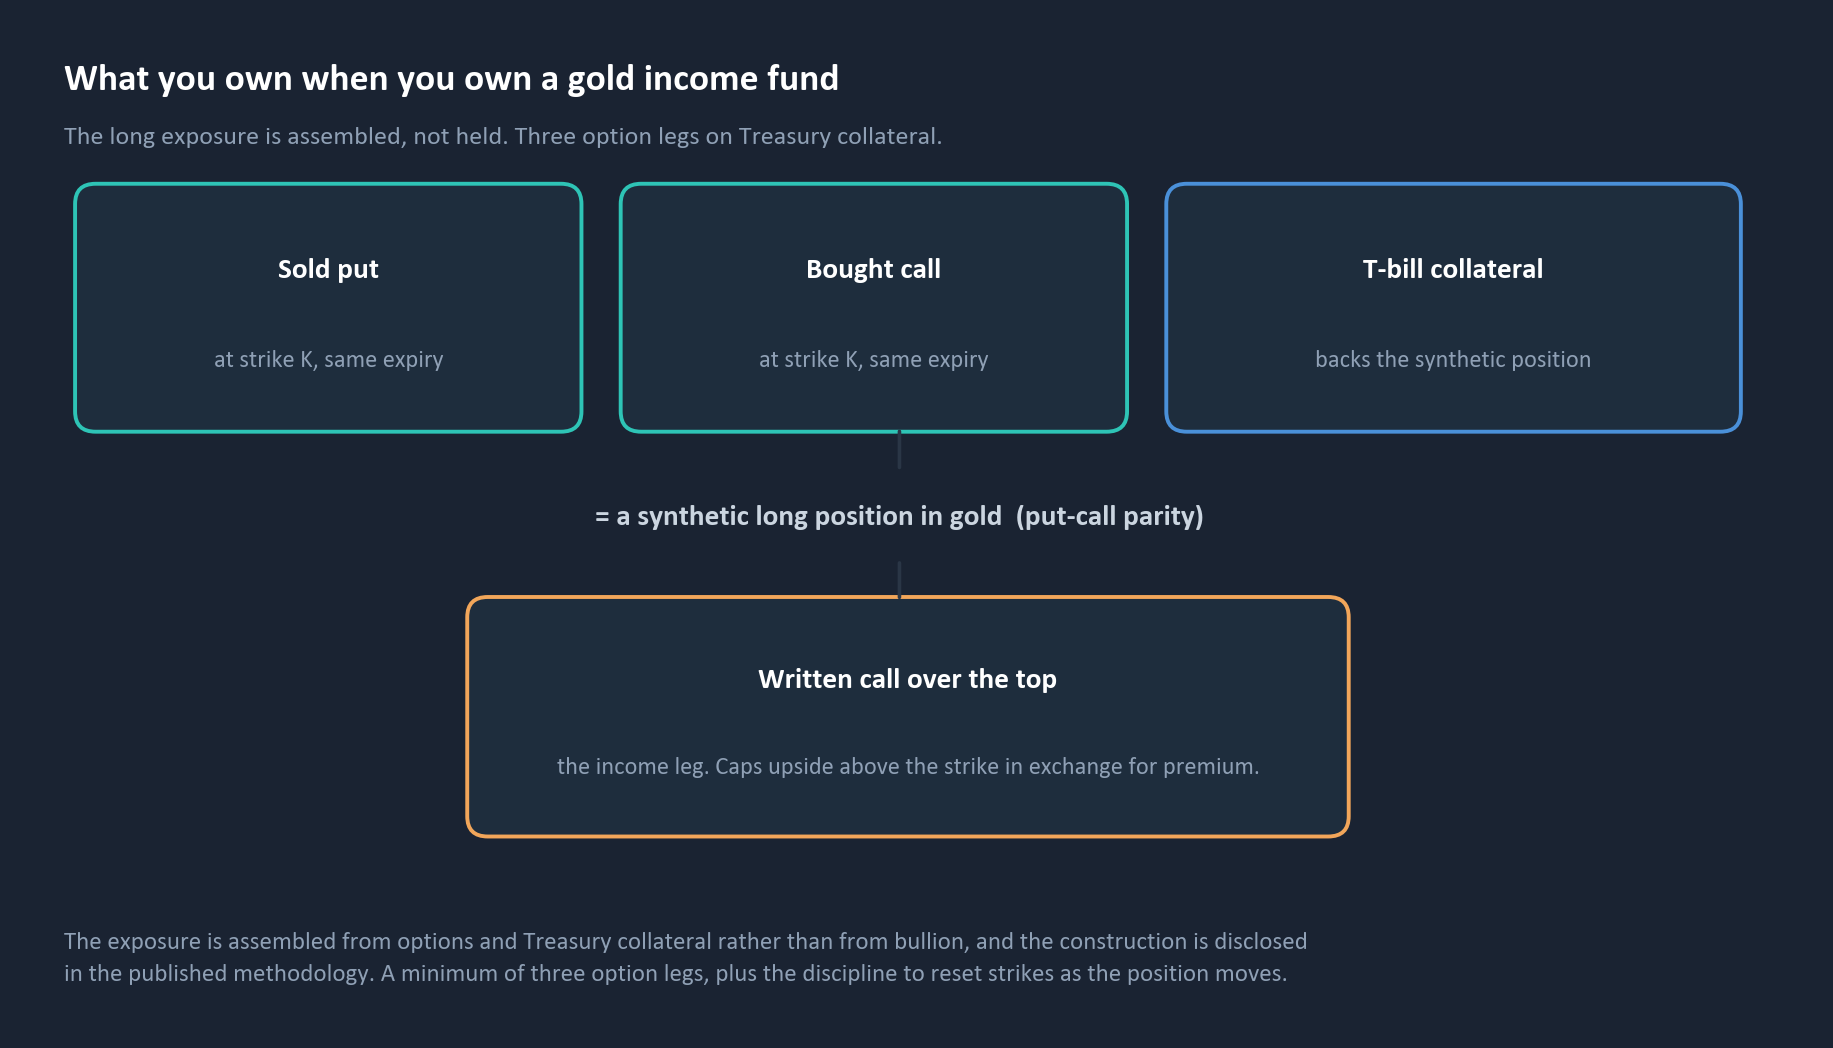
The long exposure is assembled rather than held. A sold put and a bought call at the same strike and expiry combine, by put-call parity, into a synthetic long position collateralised with Treasury bills. The income overlay is a third leg written against that synthetic position. EXTERNAL
So what
An allocator who bought this to hold gold owns a derivative structure whose economics track gold. Defensible, and different. It changes the collateral profile, the capital efficiency, the behaviour in a dislocation, and what the client believes is in the account.
Three yields are published. They answer three questions.
The current distribution rate, the latest monthly distribution annualised against current net asset value, is around 15.8 to 15.9 per cent. EXTERNAL The trailing twelve-month distribution yield, the sum of what it actually paid, is 14.79 per cent. OURS The 30-day yield, the standardised measure of the rate at which the portfolio generates income, is around 2.85 per cent. EXTERNAL
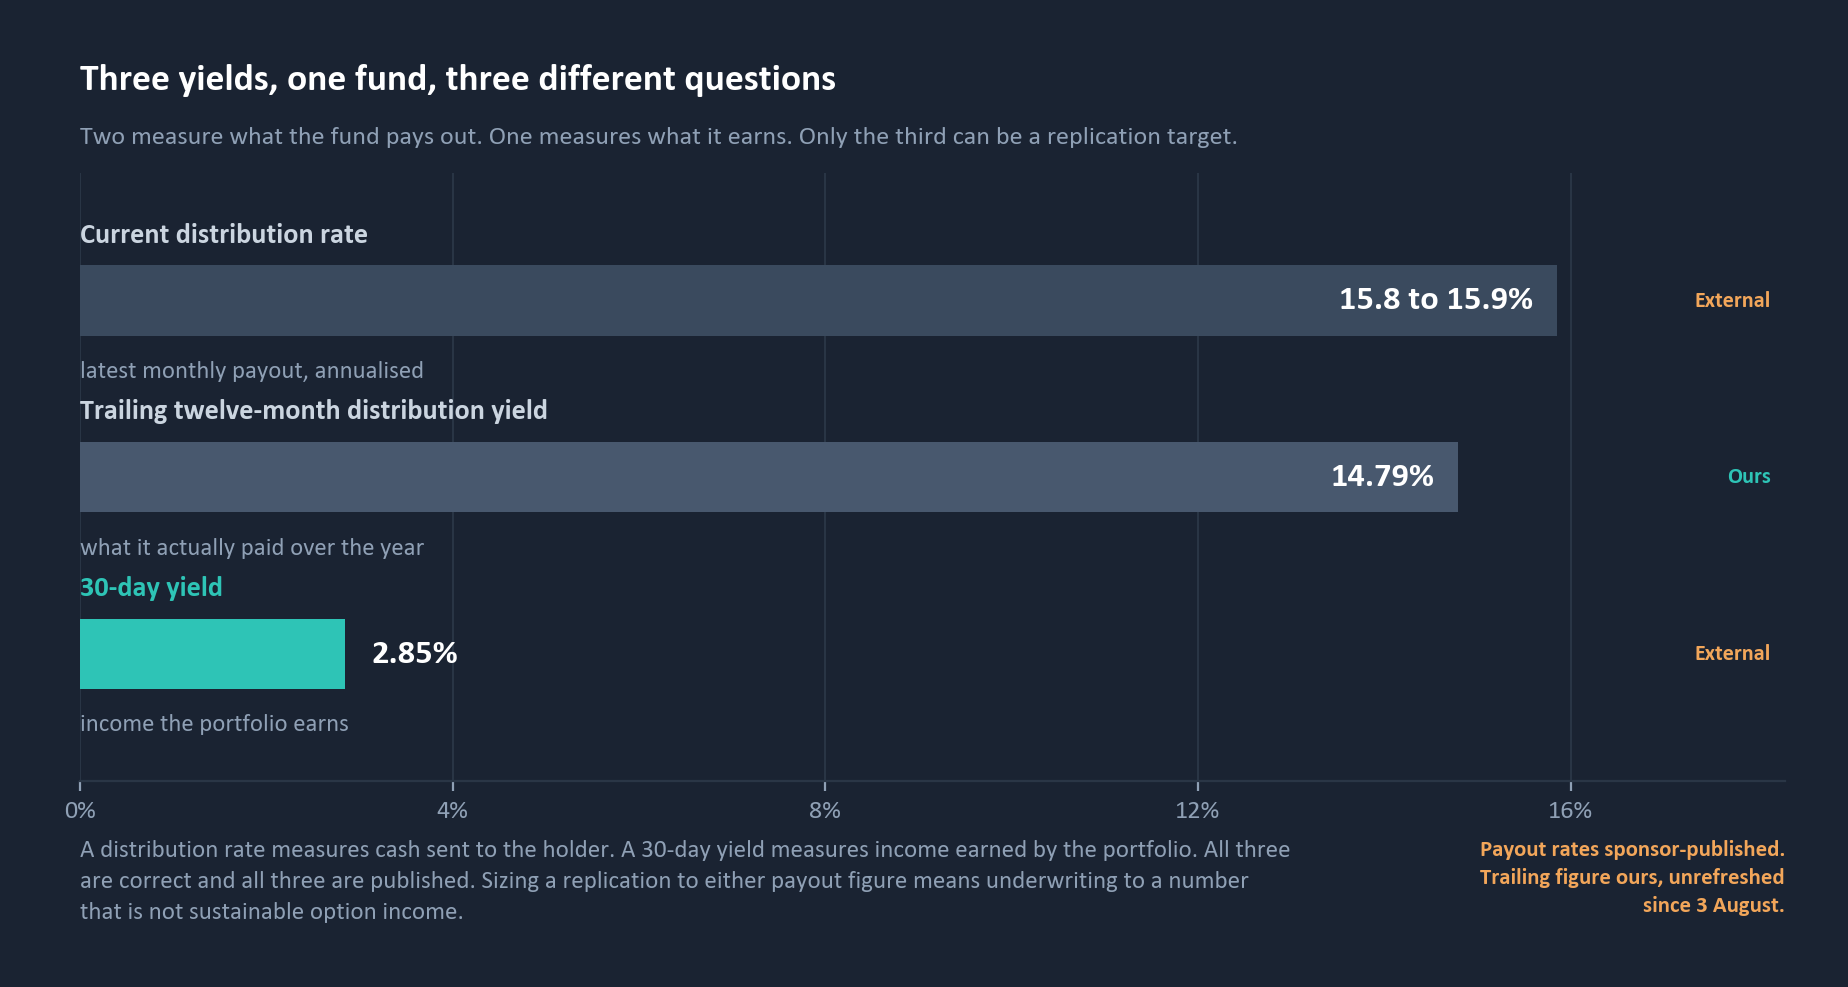
This is standard, disclosed practice for aggressive monthly-income overlay funds. All three are calculated correctly and all three are published. The difficulty is that they measure different things. A distribution rate measures cash sent to the holder. A 30-day yield measures income earned by the portfolio.
So what
An adviser who sizes a replication to match 15.8 per cent is underwriting to a number that is not sustainable option income. There are two ways to hit it: take materially more risk than the packaged product takes, or return the client capital and describe it as yield. The honest target is the 2.85 per cent order of magnitude.
A fee under one per cent is true. The comparison it invites is not.
The earlier report described the listed wrapper cost as disclosed, in a range of 0.25 to 1.33 per cent, against a note cost being embedded and not itemised. That contrast holds and remains the strongest practical argument for the listed route. What it did not examine is whether those disclosed numbers are comparable to each other. Frequently they are not.
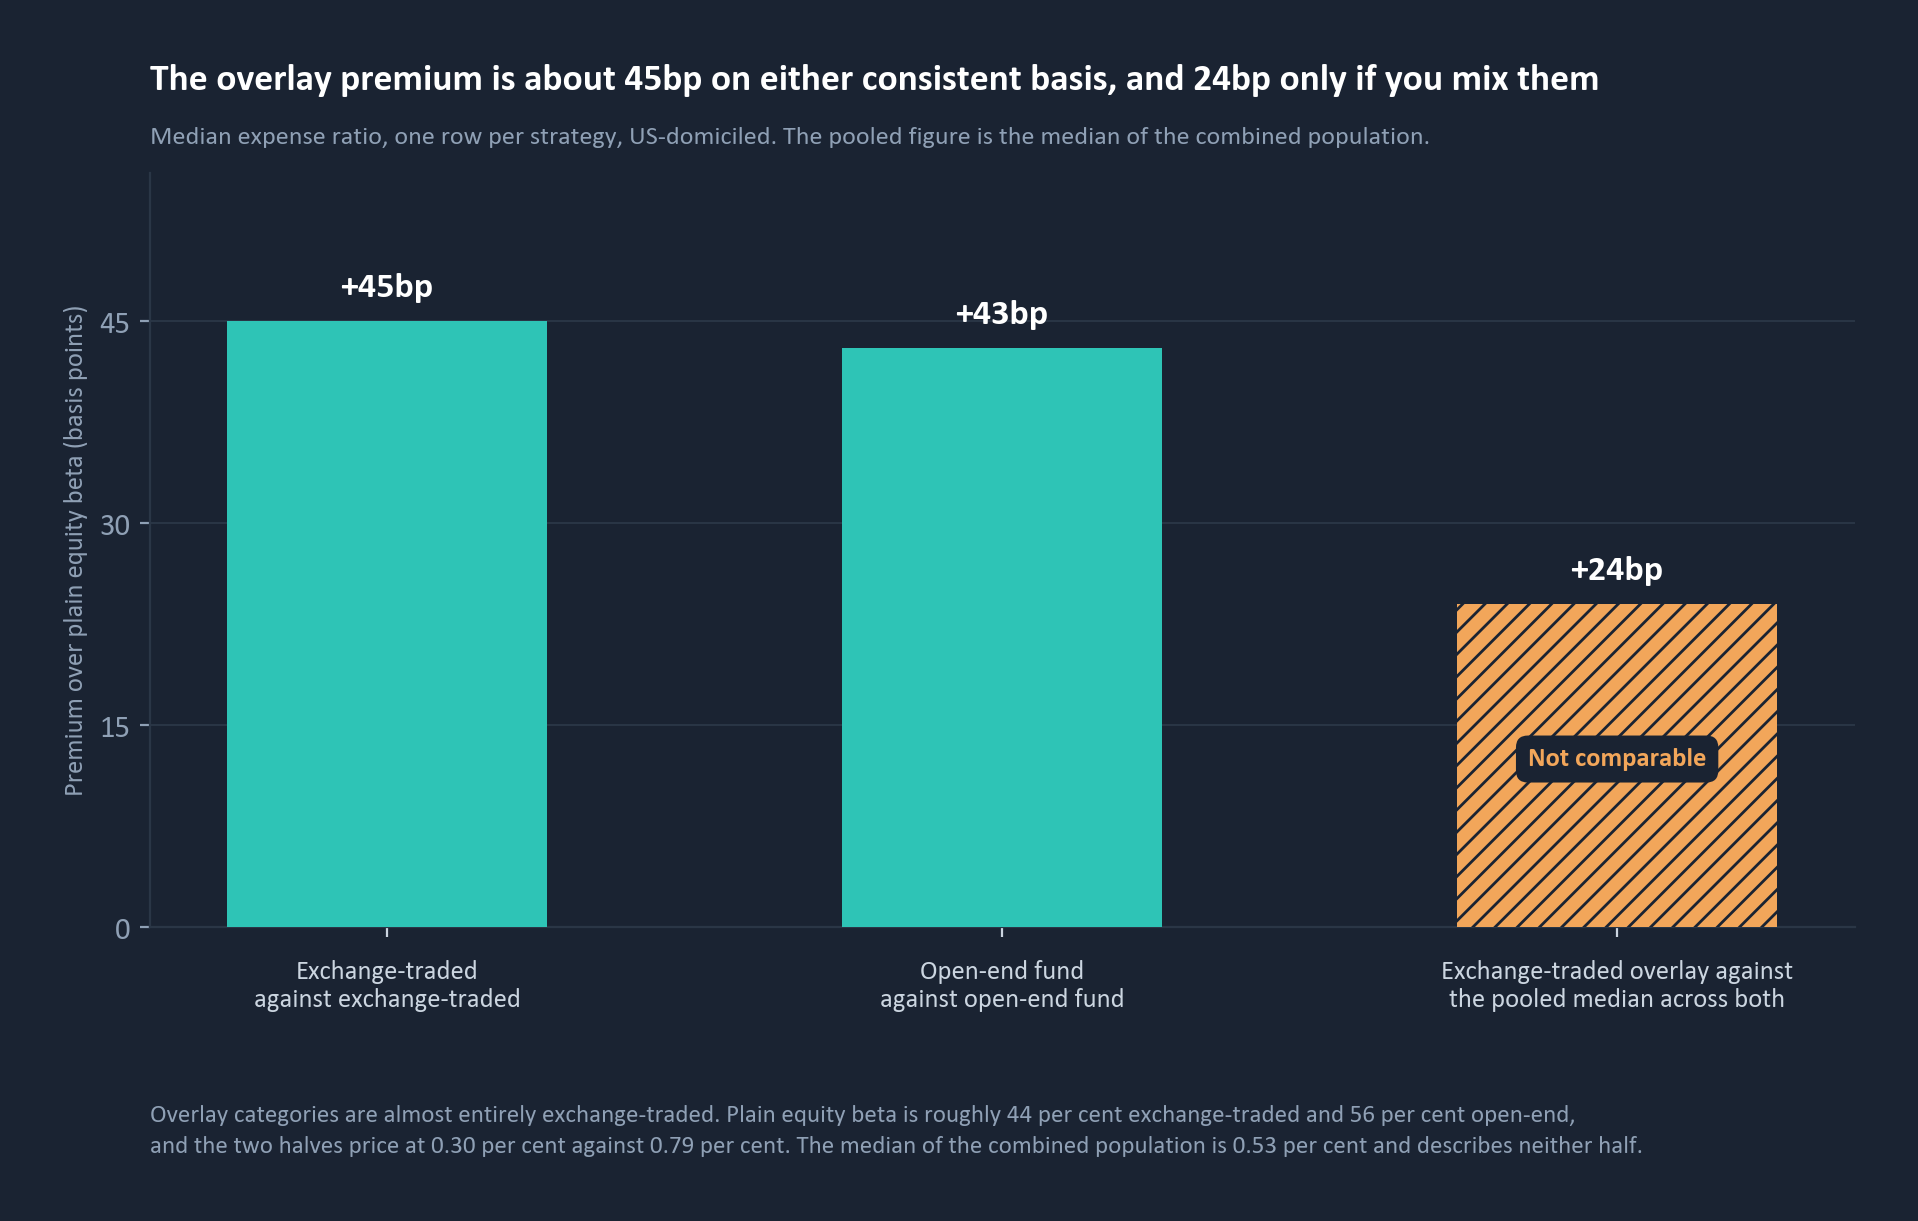
Options-overlay categories are almost entirely exchange-traded. Plain equity beta is not: it is roughly 44 per cent exchange-traded and 56 per cent open-end, and the two halves price at 0.30 per cent against 0.79 per cent. OURS That is a gap of 49 basis points inside the baseline itself, before any overlay has been priced.
| Basis | Plain equity beta | Income overlay | Defined outcome | Premium |
|---|---|---|---|---|
| Exchange-traded against exchange-traded | 0.30% | 0.75% | 0.79% | +45 to +49bp |
| Open-end against open-end | 0.79% | 1.22% | n/a | +43bp |
| Overlay against a pooled median | 0.53% | 0.75% | 0.79% | +22 to +26bp |
Every figure in the table is a median at strategy grain, including the pooled baseline, which is the median of the combined population rather than an average of the two sub-medians weighted by fund count. On the same population that weighted average is 0.58 per cent. We publish the pooled median because it is what an adviser gets by taking the category as a whole, which is the comparison this section is about.
The premium is about 45 basis points on either consistent basis, and about 24 only if you mix them. One of those baselines is half-populated with funds the overlay category cannot be bought instead of.
Where nothing is mixed, the gap is wide and uncontested
The bespoke commodity case is the cleanest comparison here, because it is one wrapper type, one fee field and one category throughout. The overlay product charges 0.99 per cent against 0.25 per cent and 0.17 per cent for physical bullion exposure, a gap of 74 to 82 basis points. OURS No basis question arises.
The same trap, visible in a single row
While assembling the comparison the fee feed returned an impossible reading: one large physical gold fund showed a fee of 0.00 per cent on its own row, and its ticker was shared by an unrelated European gold-miners fund carrying 0.55 per cent. OURS Two different funds, one ticker, one figure that cannot be right. We excluded both and are saying so here, rather than publishing a table that looked clean.
So what
The premium is real, and it is larger than the tidy version. What matters more is where the trap sits. It is not in an exotic corner of the data. It is inside the most natural comparison an adviser could run, on the most ordinary question they could ask: what does this cost against plain beta. Ask it without settling which wrapper is on each side, and the answer is out by roughly half.
So the shelf screen grows three checks
Before a shelf product can be compared to a build, three questions have to be answered, in order. What does it hold, because the name is not the holding. Which of its yield figures is a standardised measure, because a distribution rate is a payout policy and cannot be a replication target. On what basis is the fee recorded, because a comparison spanning wrapper types will understate the premium unless the basis is stated.
What has not changed: steps two and seven remain the gates, the route logic is undisturbed, and the decision reverses completely wherever the wrapper carries an attribute a listed-options replication cannot reproduce at any price. A Sharia-compliant structure using Murabaha or Wakala contracts, a contractual principal floor, or embedded issuer credit. In each of those the cost comparison is not close; it is irrelevant. JUDGEMENT
The conclusion
The earlier report ended on the note: the cost is not absent, it is unquoted. This one ends on the listed route, and it is the less comfortable of the two. The cost is quoted, the holdings are disclosed and the yield is published, and all three still have to be read. Disclosure and comprehension are not the same thing.
What we could not establish
Two of the three yield figures are not ours. The current distribution rate and the 30-day yield are sponsor-published and cross-checked against independent trade press. Only the trailing twelve-month figure comes from our platform, and that field has not refreshed since 3 August, so we report it as last known rather than live.
We hold no data on the fund that prompted the question. It is a private-placement vehicle with no public fund-data coverage, so the work runs on the listed comparable rather than on the product an adviser was actually shown.
We cannot price a replication. Our catalog holds no current gold-options implied-volatility or skew data, so the conclusion that replication wins at sufficient scale is directional rather than priced. Sizing a real overlay needs live exchange or over-the-counter option quotes, which sit outside our data and inside most readers own execution desks.
Expense ratio and management fee are different constructs. The premium range rests on two independently constructed bases landing between 43 and 49 basis points, rather than on either basis alone. Every fee figure quoted is a median at strategy grain, and the pooled baseline is the median of the combined population rather than a weighted average of the two sub-medians.
One regional question is excluded rather than answered. Our sources disagree on the direction of European demand for the overlay categories over the same window, so no regional claim appears here.
If you are being shown one of these, send us the fact sheet.
Our earlier report asked for term sheets, and that stands. This one asks for something easier. If a product is already on the shelf and someone is proposing it, send the fact sheet and we will run the three checks against it: what it holds, which of its yield figures is standardised, and what its fee actually compares to. If the answer is that it is the right instrument at a fair price, that is what we will tell you.
Important information
Publisher and purpose. This material is published by Three Horizons Capital as part of its Intelligence Series. It is provided for general information and educational purposes only and reflects our views as of the date of publication, which are subject to change without notice. We are under no obligation to update it.
Not advice, not a recommendation, not an offer. Nothing in this material constitutes, or should be construed as, investment, legal, tax, accounting or other advice, a research recommendation, or an offer, invitation or solicitation to buy, sell, subscribe for or transact in any security, fund, commodity or strategy. It is not a personal recommendation and does not take account of the objectives, financial situation, knowledge, experience or needs of any person. Three Horizons Capital is not a regulated entity.
No products, issuers, funds or providers are named. By editorial decision, no individual fund, provider, issuer or ticker is identified anywhere in this material. The analysis runs on a public listed comparable so that every figure can be checked independently.
Sponsor-published figures. The current distribution rate and the 30-day yield are published by the fund sponsor and cross-checked against independent trade press. They were re-confirmed on 19 August 2026 and are not derived from our data. They should be re-confirmed against the current fact sheet before any client use.
Scope and basis of the fee data. Fund counts, category fee levels, wrapper-type splits, the trailing twelve-month distribution yield and the gold fee comparison are derived from the Three Horizons Capital data platform as at 19 August 2026, with portfolio holdings data as at 8 August 2026. One physical comparator carries a 14 August extraction. Figures are US-domiciled, computed at strategy grain on distinct portfolios rather than share classes, and every fee figure is a median. Morningstar category is used as the classification construct.
Carried forward from the earlier report. Overlay category fee levels are as published in our earlier report on structured products, dated 11 August 2026 and published 12 August 2026, from fund data as at 6 August 2026. Tax treatment referred to in that report is general commentary and should be confirmed with qualified counsel.