Since the spring, one description of investor behaviour has become close to consensus. Geopolitical risk has moved from an episodic worry to a standing condition, so investors are buying gold and selling the government bonds that used to be ballast.
It is a coherent story and it explains several things at once. We had written parts of it ourselves. Then we went back to the underlying records, and found that the advisers had not said it, the money had not done it, and the models most people use could not have priced it if they had.
What this note is
Not a view on the price of gold, the level of yields, or the course of the conflict. It is an account of what actually moved, what the people advising clients actually said, and what the standard assumption set is actually built to handle. The three agree with each other. The story is the outlier.
What is measured and what is inferred
Four tags run through this note. VERIFIED means we recomputed it ourselves from the underlying records and it is an observed quantity, with no model between the number and the money. MODEL means an attribution model produced it, it carries error, and we show every component including the part the model cannot explain. JUDGEMENT means it is our reading and reasonable people will differ. WORK means it is not a claim about the market at all. It describes something we would do, and it is tagged so that the commercial part of this note is held to the same labelling as the analysis.
Nobody sold the ballast
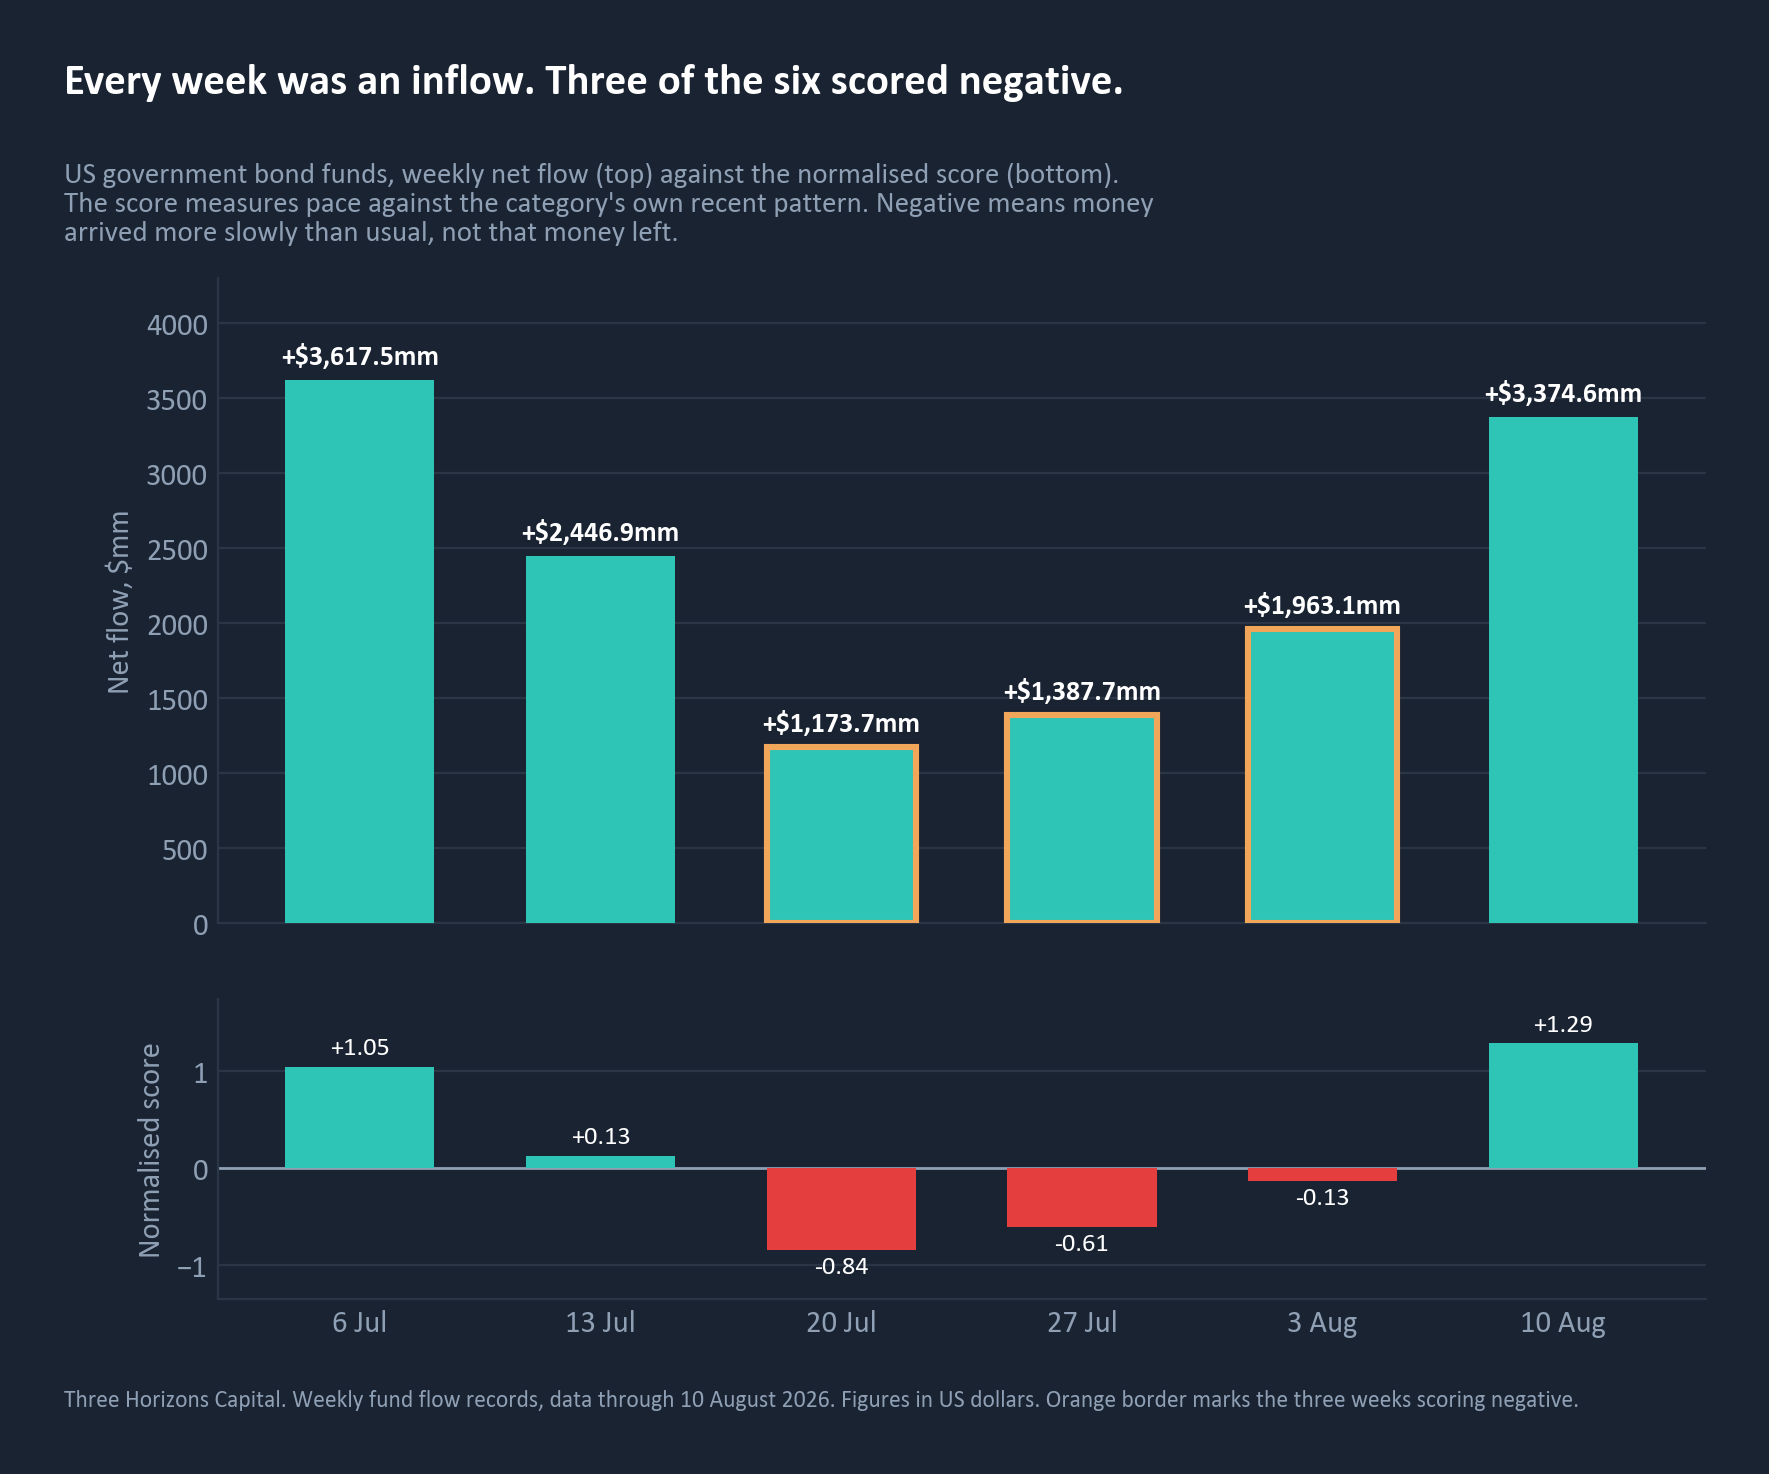
United States government bond funds took in money in every one of the six weeks to 10 August, between +$1,173.7mm in the quietest week, ending 20 July, and +$3,617.5mm in the largest, ending 6 July. VERIFIED Across the six weeks the total is +$14.0bn. All six weeks we measured recorded an inflow.
Three of those six weeks nonetheless carry a negative normalised score, and that is where the story came from. The score measures a week’s flow against that category’s own recent pattern. A negative reading means money arrived more slowly than usual. It does not mean money left. In the three negative weeks, between $1.17bn and $1.96bn arrived.
The measurement point, stated plainly
A measure of pace was read as a measure of direction. The two point opposite ways in exactly the conditions this summer produced: a category taking large, steady inflows where the rate of arrival slows for a few weeks from an unusually high base. We made this error ourselves. Our own first pass described the United States as selling duration and reached a recommendation on that basis. It took a re-derivation from the underlying records to catch it.
The composition defence, and why it does not hold
The reasonable objection is that money moved down the curve, out of long duration and into bills, and the category total conceals it. Splitting the same flows by maturity bucket, 15 June to 11 August. VERIFIED
| Maturity | Net flow | Funds |
|---|---|---|
| Ultra short | +$4,236.7mm | 28 |
| Short | +$3,953.8mm | 23 |
| Long | +$3,835.5mm | 27 |
| Broad | +$2,827.6mm | 29 |
| Intermediate | +$2,117.6mm | 38 |
| Maturity runoff | +$542.3mm | 24 |
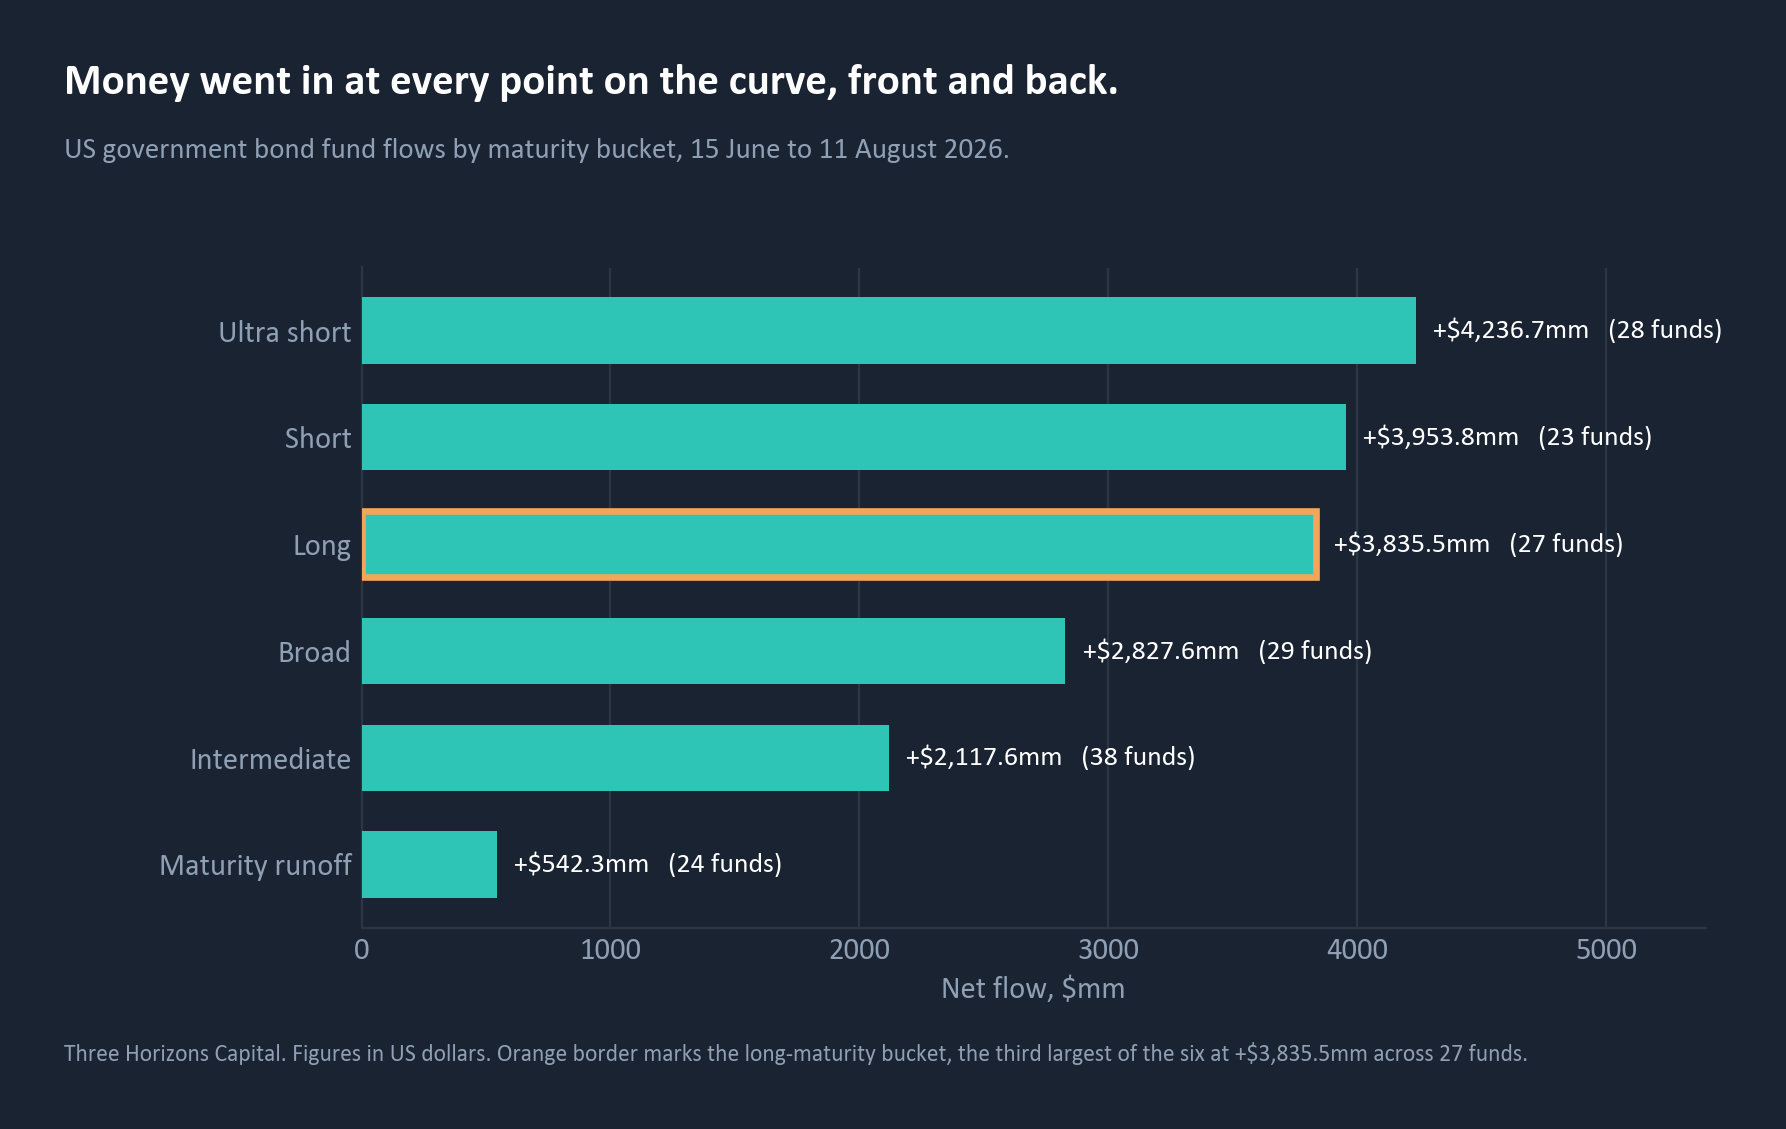
All six maturity buckets in our set recorded net inflows over that window. Long maturity is the third largest at $3.84bn across twenty-seven funds, and +$3,613.1mm restricting to Treasury exposure alone.
So what
If a positioning case rests on the premise that the market has stopped treating government bonds as ballast, that premise is not in the data. It may still be right as a forecast. It is not currently a description, and the two should not be argued as though they were the same thing.
What advisers said, and what the money did
If a rotation were underway, the people advising clients would be the first to say so. We hold a panel of 17,934 positioning statements from 2,499 advisers. 7,858 of them carry a publication date, and the dated 2026 subset used below is 2,096 statements from 523 advisers. It says something quieter than the coverage does. VERIFIED
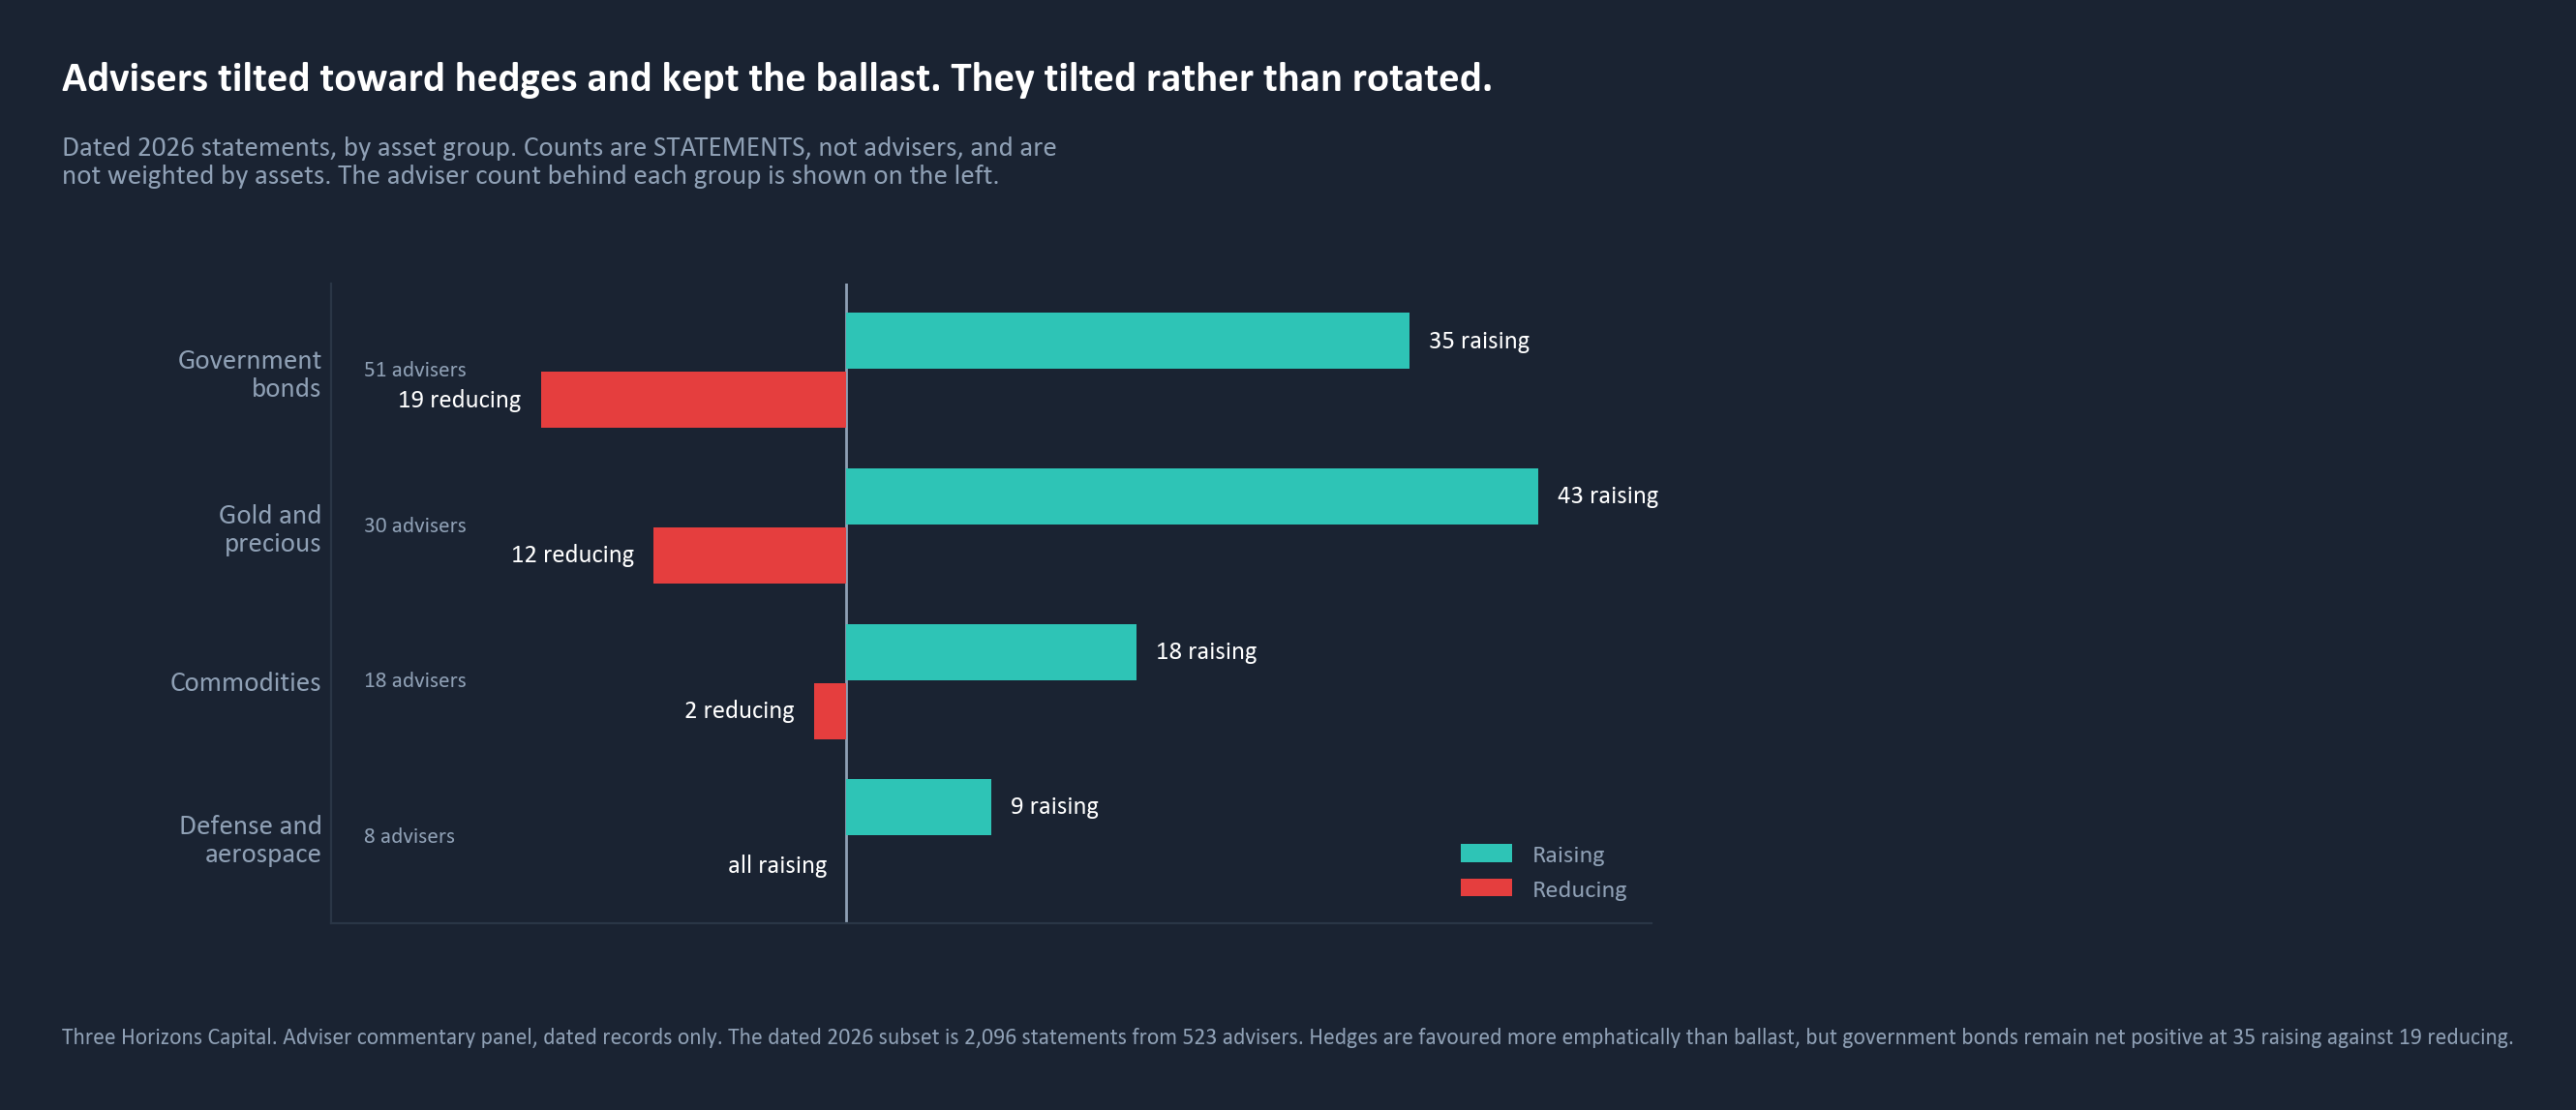
Counts here are statements, not advisers, because an adviser may comment more than once. On gold and precious metals, 43 statements raised against 12 that reduced, across 30 advisers. On commodities, 18 against 2 across 18 advisers. On defense and aerospace, 9 statements across 8 advisers, all of them raising. The tilt toward hedges is real and it is one-sided.
But on government bonds the panel reads 35 raising against 19 reducing across 51 advisers. Net positive. Nobody was telling clients to abandon ballast, and the flows show clients not abandoning it. Said and done agree.
The gold buying is real, but younger and more regional than the story
Over the eight weeks to 3 August, United States precious metals funds averaged -$17.1mm per week. VERIFIED Approximately flat. The buying arrives at the very end of the window, +$1,158.9mm on 3 August and +$1,587.9mm on 10 August. A fortnight, not a quarter. Europe is the genuine case, averaging +$224.3mm per week of net buying across the same eight weeks, steadily rather than at the end.
| Component, average per week | United States | Europe |
|---|---|---|
| Observed net flow | -$17.1mm | +$224.3mm |
| Persistent component | -$107.3mm | +$810.7mm |
| News-driven component | +$1,222.9mm | -$1,379.1mm |
| Unexplained residual | -$1,132.7mm | +$792.6mm |
| Residual share of attribution | 49.7% | 24.8% |
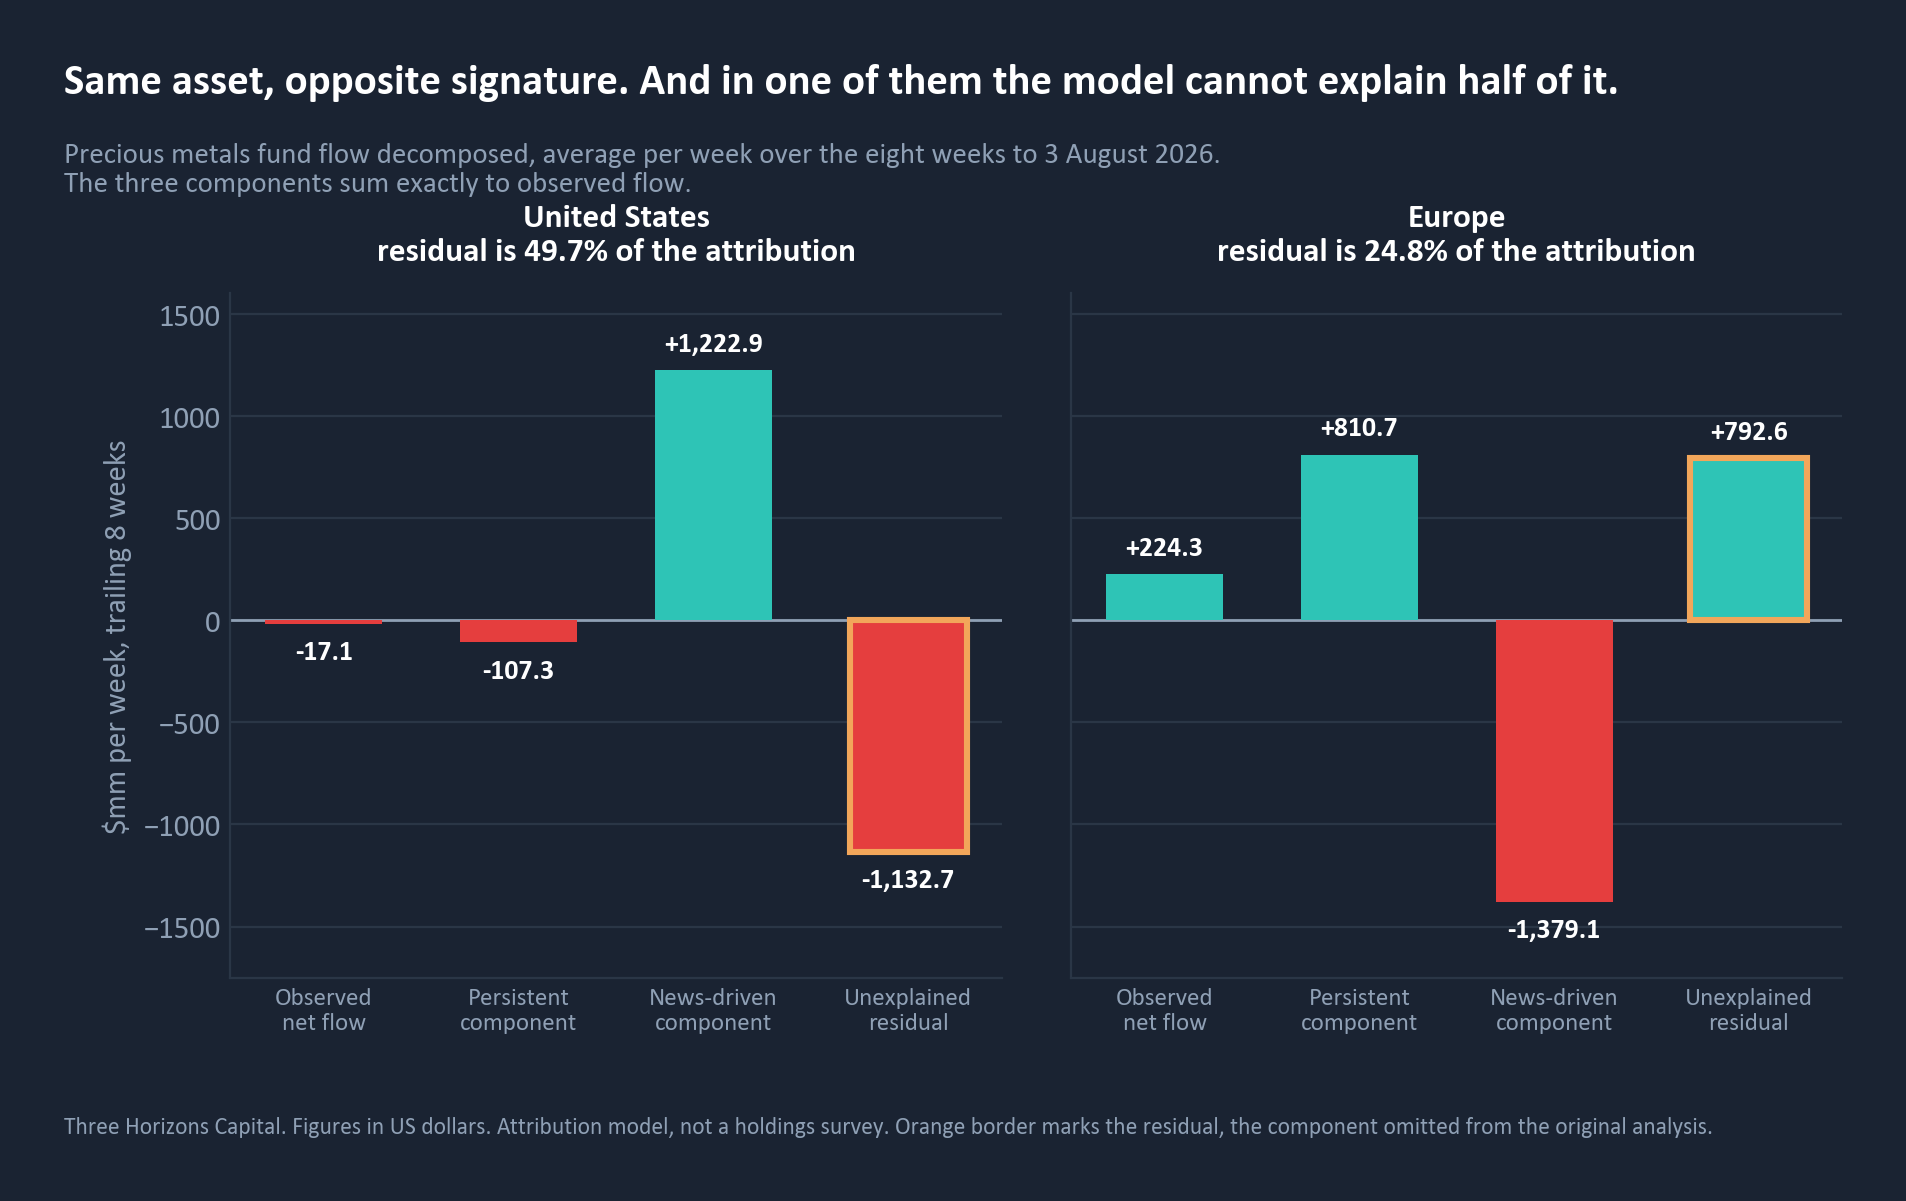
Read the American column carefully: the news-driven component is large and positive, and almost exactly cancelled by a residual of similar size and opposite sign. Quote the first two rows without the third and you produce a picture of heavy sentiment-led buying. Include the third and observed flow is approximately flat, which is what it was. We show the residual because the alternative is to publish a number the next line down withdraws. MODEL
The slowest money has not moved
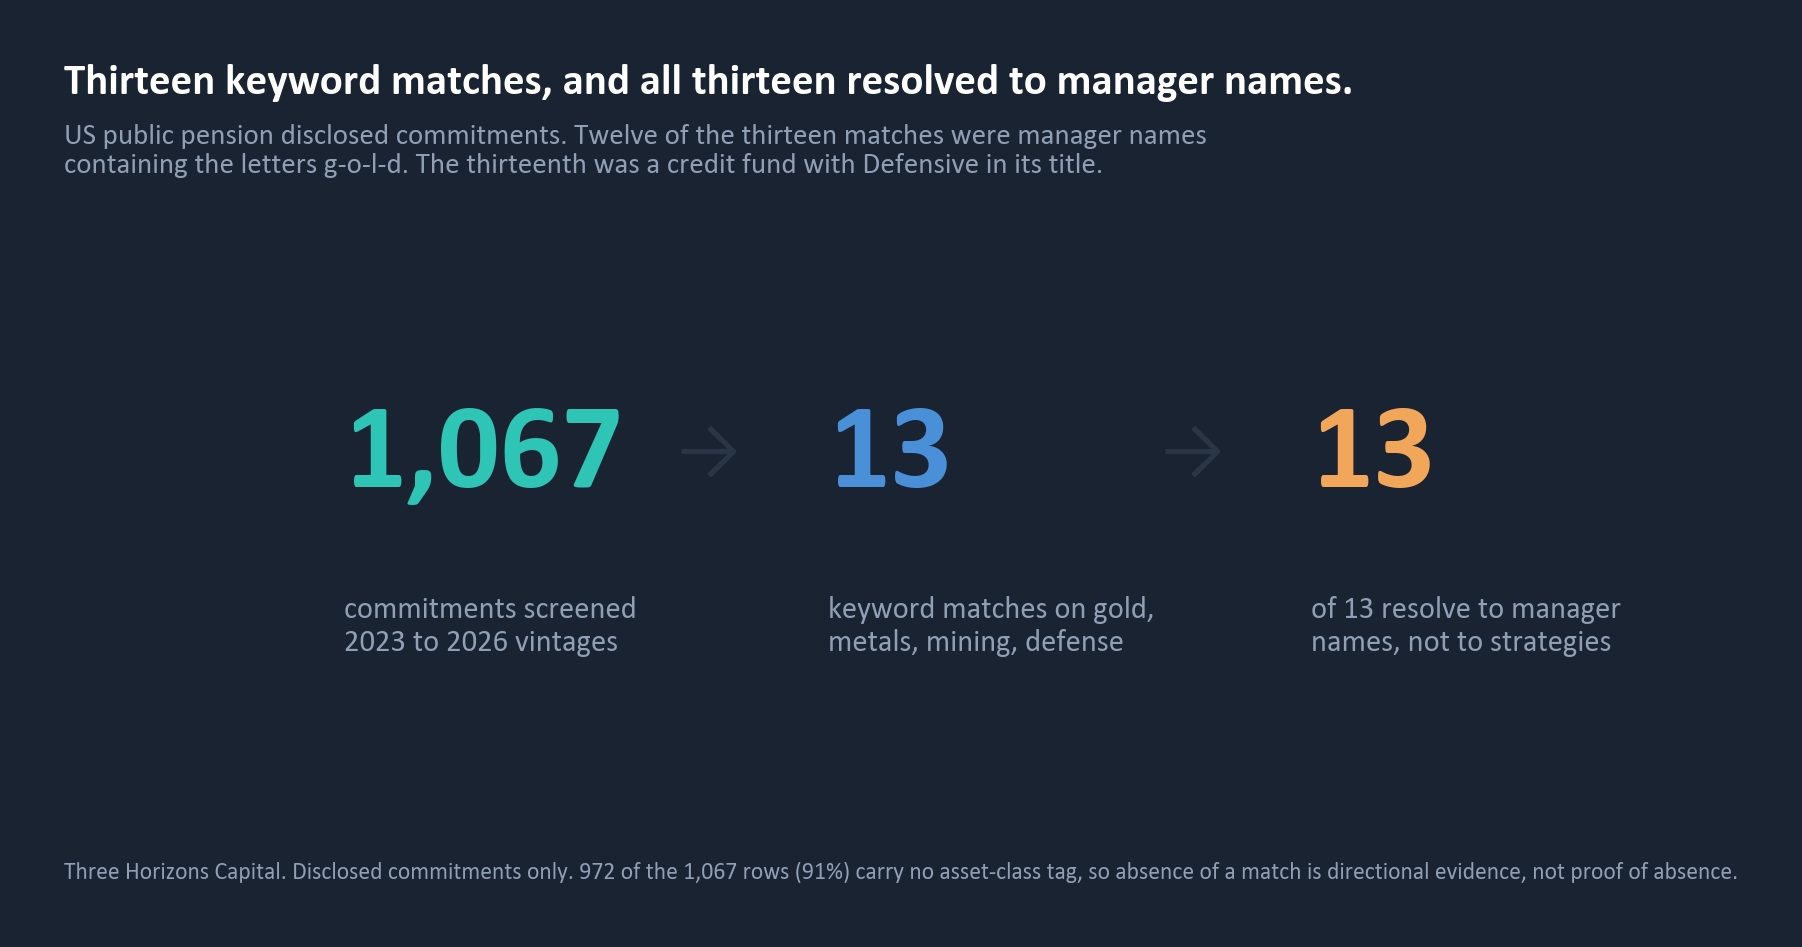
Across 1,067 disclosed United States public pension commitments in 2023 to 2026 vintages, a screen for gold, precious metals, mining, defense or aerospace strategies returns 13 matches, all of which resolve to manager names rather than to strategies. VERIFIED The caveat is large and we state it rather than lean on the result: 972 of those 1,067 records, 91%, carry no asset-class tag, and a fund whose name does not announce its strategy would not be caught. The honest claim is that no commitment named for these strategies appears in four vintage years, which is weaker than saying pensions hold none.
So what
Advisers tilted toward hedges and kept the ballast. The money did the same. Every source we hold agrees with every other source we hold, and the only thing that rotated was the way the position was described.
What the assumptions are actually built for
If a persistent conflict is the risk, the natural next question is what a standard toolkit does with it. The answer is uncomfortable, and it is a matter of record rather than opinion. The standard stress library holds three scenarios: a normal recession, a hard recession of the 2009 kind, and a bond shock of the 2022 kind. VERIFIED All three are growth shocks or rate shocks.
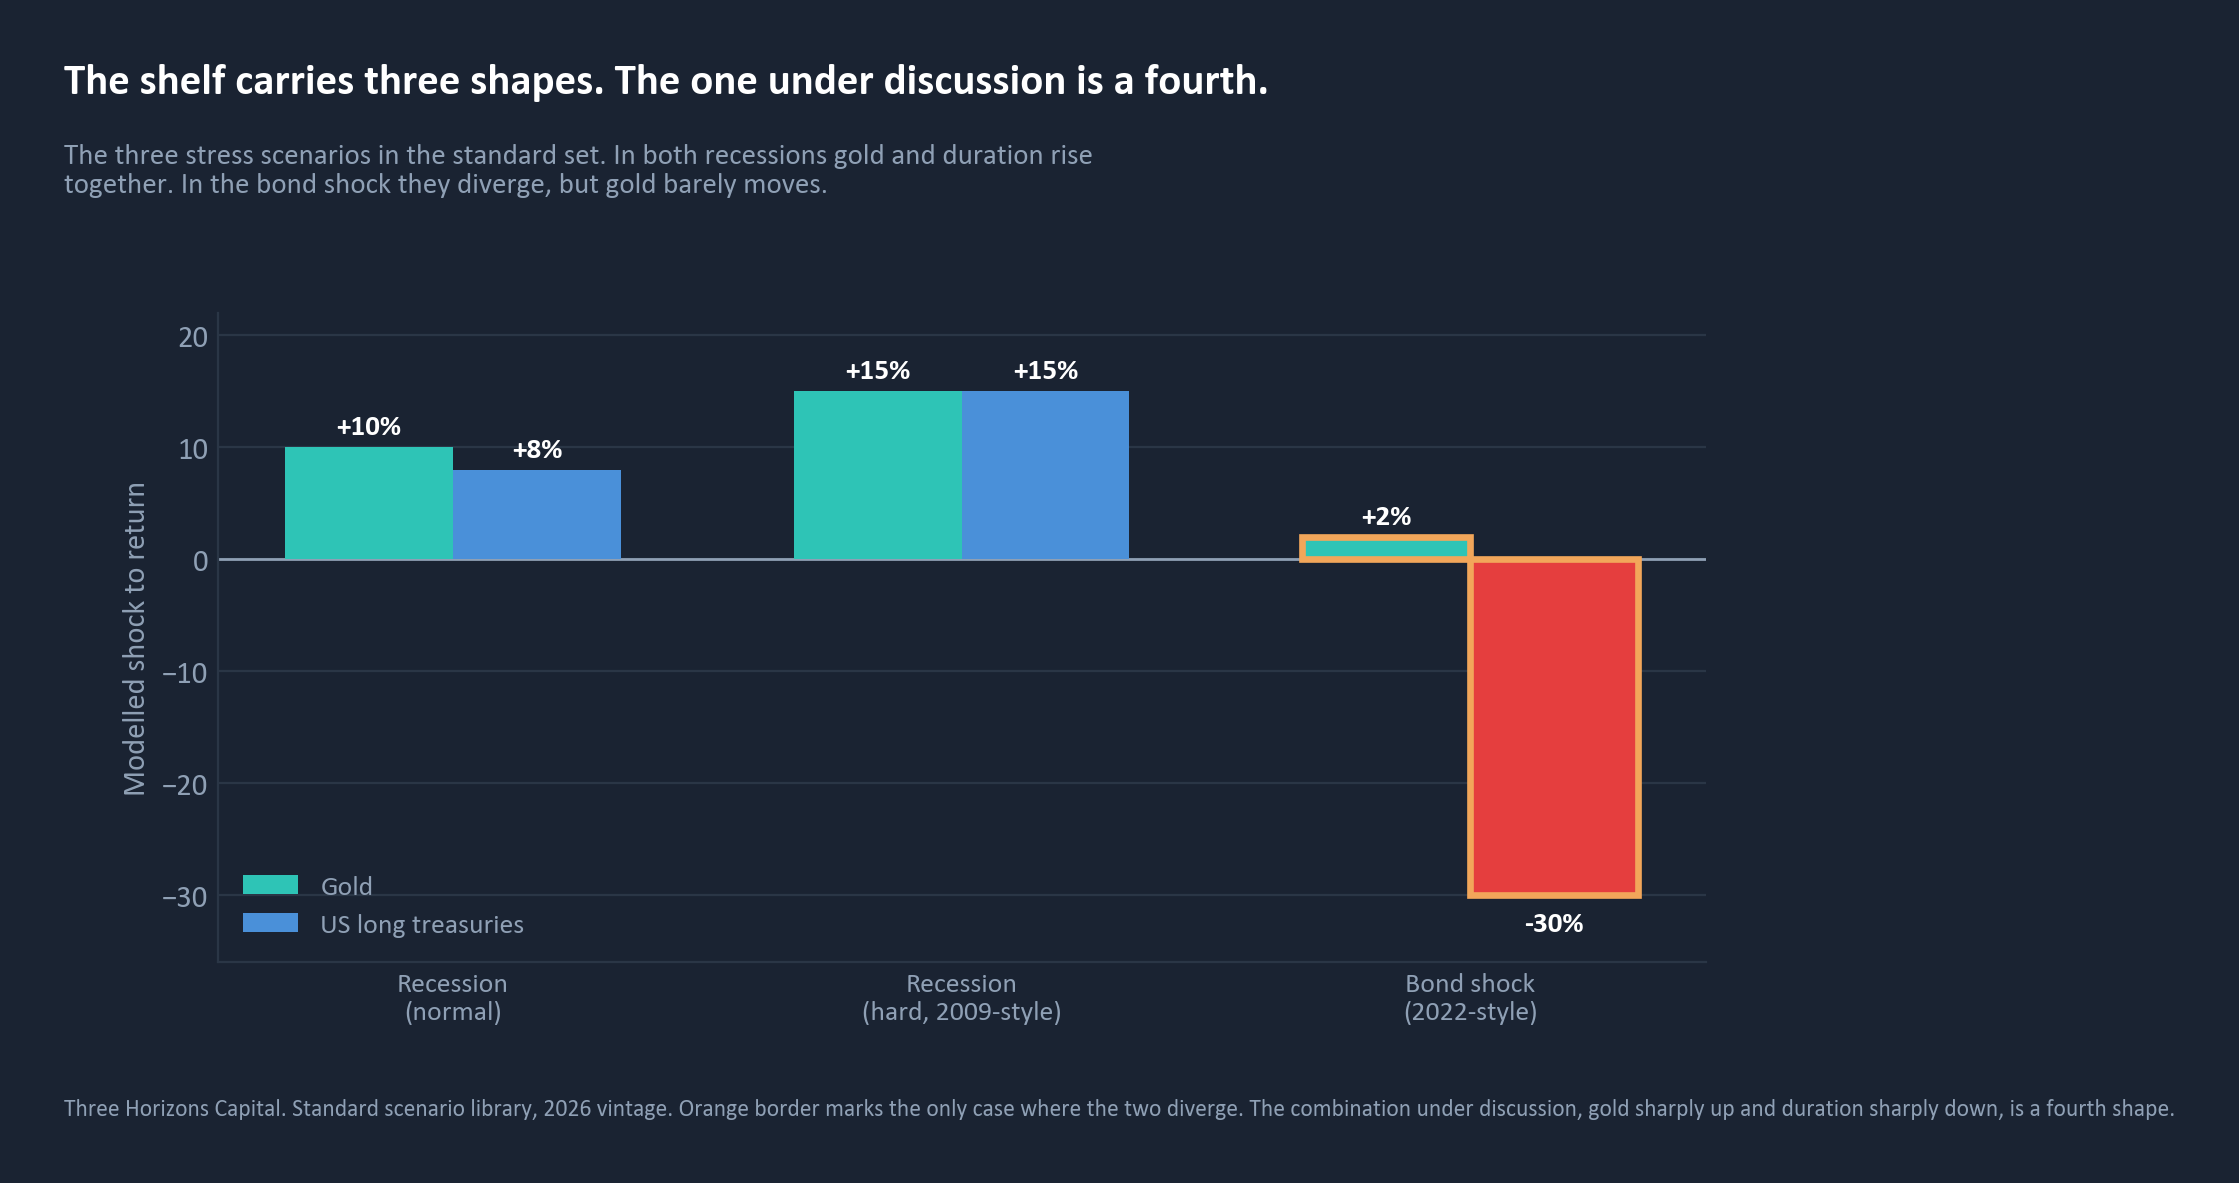
In the normal recession gold is modelled at +10% and long Treasuries at +8%. In the hard recession both are at +15%. Only the bond shock separates them, and there gold is nearly flat at +2% against long Treasuries at -30%. In all three, gold and duration either rise together or gold barely moves. The combination under discussion, gold sharply higher while duration sells off, is a fourth shape, and the toolkit has not been asked to carry it.
And most providers cannot help you size the hedge
Seven providers publish 2026 long-term assumptions in our set. Three publish a commodities line, a fourth publishes a listed natural resources line, and one publishes a gold assumption. VERIFIED
| Provider coverage, 2026 vintage | Compound return | Volatility |
|---|---|---|
| Commodities, provider A | 2.3% | 14.3% |
| Commodities, provider B | 3.5% | 18.0% |
| Commodities, provider C | 3.8% | 18.3% |
| Natural resources, provider D | 6.4% | not published |
| Gold, the only provider publishing one | 4.0% | 16.7% |
The three commodities lines span 2.3% to 3.8% on return while agreeing on volatility within four points. The providers differ by roughly 150 basis points a year on the asset and barely at all on its risk. Providers are not named here, consistent with the rest of this note.
A correction we are publishing rather than absorbing
The fourth line above looked like a commodities assumption and is not. It is a listed natural resources line, and our own mapping layer had merged it into the commodities bucket, which is where the wider spread we first computed came from. Separating the two took a re-derivation against raw published names. It is the same error as the one in section 01, committed by us, one layer further down.
So what
You cannot stress this risk with the standard scenario set, and for six providers out of seven you cannot price the asset most people are using to hedge it. The gap is not in anyone’s portfolio. It is in the toolkit everyone is using to think about the portfolio.
What would change our reading
We hold no data on the geopolitical calendar and we are not going to speculate about it. What we can do is publish the thresholds at which this reading would change, so that a reader can check them independently and hold us to them. JUDGEMENT
| Threshold | What it would mean |
|---|---|
| The persistent component of US gold flow turns positive and stays positive for four consecutive weeks | The American pattern has become accumulation rather than reaction, and the fortnight-old turn has become a position. This is the one we watch most closely. |
| Government bond flow turns negative in dollars, not merely in the normalised score | An actual rotation has begun. Every week in the period examined here recorded an inflow instead. |
| A defense or aerospace category appears in the fund taxonomy at all | The industry has recognised a structural theme rather than a handful of funds gathering assets. Today the closest proxy in the taxonomies we run is the thematic equity bucket. |
| A second provider publishes a gold assumption, or any provider publishes a conflict scenario | The assumption set is catching up with the conversation, and the risk becomes modellable rather than merely discussable. |
How we read it
Taking the three together, and stating this as a reading of the evidence rather than as advice: JUDGEMENT
The flows say this is not yet a repositioning. One region is accumulating steadily, one turned a fortnight ago, one contradicts the thesis outright, and the slowest money has not moved. That is an early-stage picture, not a consensus.
The assumption set says that if it becomes one, most standard toolkits are not built to price it. Three scenarios, all of them growth or rate shocks, and gold coverage in one provider out of seven.
The reading
Those two facts together are the reason to look now rather than later. Not because the trade is obvious, but because the measurement is not. Anyone acting on this is acting ahead of both the institutional channel and the modelling toolkit, and that is a defensible thing to do deliberately and an uncomfortable thing to discover afterwards.
What this looks like against a book
Everything above is a reading of the market. The same three tests run against a single portfolio answer a narrower and more useful question, and each one falls directly out of a finding in this note. WORK
| The work | What it produces |
|---|---|
| Separate the dollars from the pace, in your own reporting | The same decomposition run across the categories a portfolio actually holds, net flow and normalised score side by side, marking every position where the two point in opposite directions. Those are the positions where a reader of your own reporting is most likely to reach the conclusion corrected in section 01. |
| Price the shock the shelf does not carry | A supply-side scenario built as the fourth shape and run against an allocation across all eight assumption sets we hold, seven of them on the same 2026 vintage used above, rather than the single set a toolkit ships with. The spread between providers is the output. |
| Find the product before the taxonomy names it | For a manager rather than an allocator: which adjacent buckets are taking the money, at what pace, how that differs across the five markets in this note, and what the adviser panel is saying about each. A real bid with no category name is where a shelf gap sits. |
The question worth asking
The last time you were shown evidence that the market had moved, was it a measure of how much money moved, or a measure of how quickly it arrived relative to normal? Those two answers point in opposite directions more often than is comfortable.
We will run the first of the three on a single portfolio at no cost, because the fastest way to show what the distinction is worth is to find it in something you already hold. Any of the three is the same work as this note, pointed at your book instead of the market.
What this note does not contain
- No view on the price of gold, the level of yields, or the course of the conflict. This is an account of what moved, what advisers said, and what the standard assumption set is built to handle.
- No recommendation, allocation or instrument. The closing section describes work we would do, not a position a reader should take.
- No named fund, provider, issuer or adviser, anywhere. By editorial decision, consistent with the rest of the Intelligence Series.
- No family-office survey. We hold no dataset that tags anything as a family office. The wealth-advisory channel and realised fund flows are the closest available proxy and are what is measured here.
- No account of why the money moved. We examined the news-theme attribution behind precious metals flow and it would not reproduce. Earlier work of ours characterised those drivers more confidently, in both directions. That characterisation is withdrawn rather than reworded. We can see what money did; we cannot currently say why.
- No Canadian or Australian read. Canadian government bond and thematic series have not updated since 23 February 2026 and Australian data since 29 June 2026. Neither supports a current read and none is drawn.
Verification statement
Every figure in this note was recomputed from source for this publication. Where a figure originated in earlier internal analysis it was re-derived rather than carried forward. Four claims from that analysis did not survive and have been corrected or withdrawn here, two of them in our own previously verified output.
The adviser panel carries a publication date on 43.8% of records, so the dated 2026 subset used above is a fraction of the whole. Counts are of statements, not weighted by assets, and the per-group adviser counts range from 8 to 51, which is small.
Claims are tagged VERIFIED where we recomputed them ourselves from the underlying records with no model between the number and the money, MODEL where an attribution model produced them and every component including the unexplained residual is shown, JUDGEMENT where it is our reading and reasonable people will differ, and WORK where it is not a claim about the market at all but a description of something we would do.
Important information
Publisher and purpose. This material is published by Three Horizons Capital Limited, a company registered in Dublin, Ireland ("Three Horizons Capital", "3HC", "we", "our") as part of its Intelligence Series. It is provided for general information and educational purposes only and reflects our views as of the date of publication, which are subject to change without notice. We are under no obligation to update it.
Not advice, not a recommendation, not an offer. Nothing in this material constitutes, or should be construed as, investment, legal, tax, accounting or other advice, a research recommendation, or an offer, invitation or solicitation to buy, sell, subscribe for or transact in any security, fund, commodity or strategy. It is not a personal recommendation and does not take account of the objectives, financial situation, knowledge, experience or needs of any person.
No products, issuers, funds or advisers are named. By editorial decision, no individual fund, provider, issuer or adviser is identified anywhere in this material.
Scope of the flow data. Flow figures cover exchange-traded fund flows in five markets and exclude separately managed accounts, direct holdings, unlisted vehicles and all private wealth structures. Data is as at 10 August 2026 and all amounts are in US dollars. Fund counts are computed on distinct portfolios rather than share classes.
The attribution split is a model, not a holdings survey. The persistent, news-driven and residual components are produced by an attribution model fitted jointly across five geographies. Across 55 evaluation windows its out-of-sample explanatory power averages 0.54, ranging from 0.18 to 0.86. It is a short-horizon cross-sectional signal, not a forecast, and at individual fund level its reliability is far lower and is not used. It was last refitted on 11 May 2026 and applied forward from there. The unexplained residual is disclosed wherever the other two components appear.
Adviser panel basis. The panel holds 17,934 positioning statements from 2,499 advisers, of which 7,858 carry a publication date. Counts are statements rather than advisers, because an adviser may comment more than once, and are not weighted by assets. Asset groups are derived from a priority-ordered crosswalk over free-text labels, one group per statement. Per-group adviser counts range from 8 to 51, which is small.
Pension commitment screen. 972 of the 1,067 disclosed commitments examined carry no asset-class tag, so the absence of a keyword match is directional evidence rather than proof of absence. The screen covers disclosed United States public pension commitments only.
Assumption sets. The provider comparison is drawn from a multi-provider long-term assumption store. The portfolio-analytics library our own tools run on is a separate, single-provider table, so no reader should infer that any optimiser sees all seven sets. The comparison is a comparison, not the input to a model.
Intended audience and distribution. This material is intended only for professional investors, institutional investors, eligible counterparties and their advisers, and is not intended or suitable for retail investors or the general public. It is not directed at, and must not be acted upon by, any person in any jurisdiction where its publication, distribution or availability would be contrary to law or regulation. Three Horizons Capital is a non-regulated entity: it is not authorised or regulated by the Central Bank of Ireland or by any other financial regulator, and this material is not a financial promotion of any regulated product or service.
No reliance; take your own advice. You should not rely on this material as the basis for any decision. Conduct your own due diligence and obtain independent financial, legal, tax and regulatory advice appropriate to your circumstances before acting. Any decision to invest is made solely at your own risk.
Forward-looking statements and performance. Past flows and past market structure are not indicative of future conditions. The value of investments and any income from them can fall as well as rise, and investors may not recover the amount originally invested.
Limitation of liability. To the maximum extent permitted by applicable law, Three Horizons Capital and its affiliates accept no liability whatsoever for any direct, indirect or consequential loss or damage arising from any use of, or reliance on, this material or its contents.