The contradiction
Gold is near a record high. Investors pulled $5.4 billion out of it this year.
Both of those statements are true, and the gap between them is this entire piece. The gold price has spent 2026 near all-time highs. Over the same period, net flows across the precious-metals fund universe have been negative $5.41 billion. Six months earlier the same aggregate read positive $12.45 billion. The swing between those two half-years is nearly eighteen billion dollars, in an asset whose price barely paused.
Something is being averaged away.
Instrument
The aggregate is meaningless, because it nets opposite trades against each other.
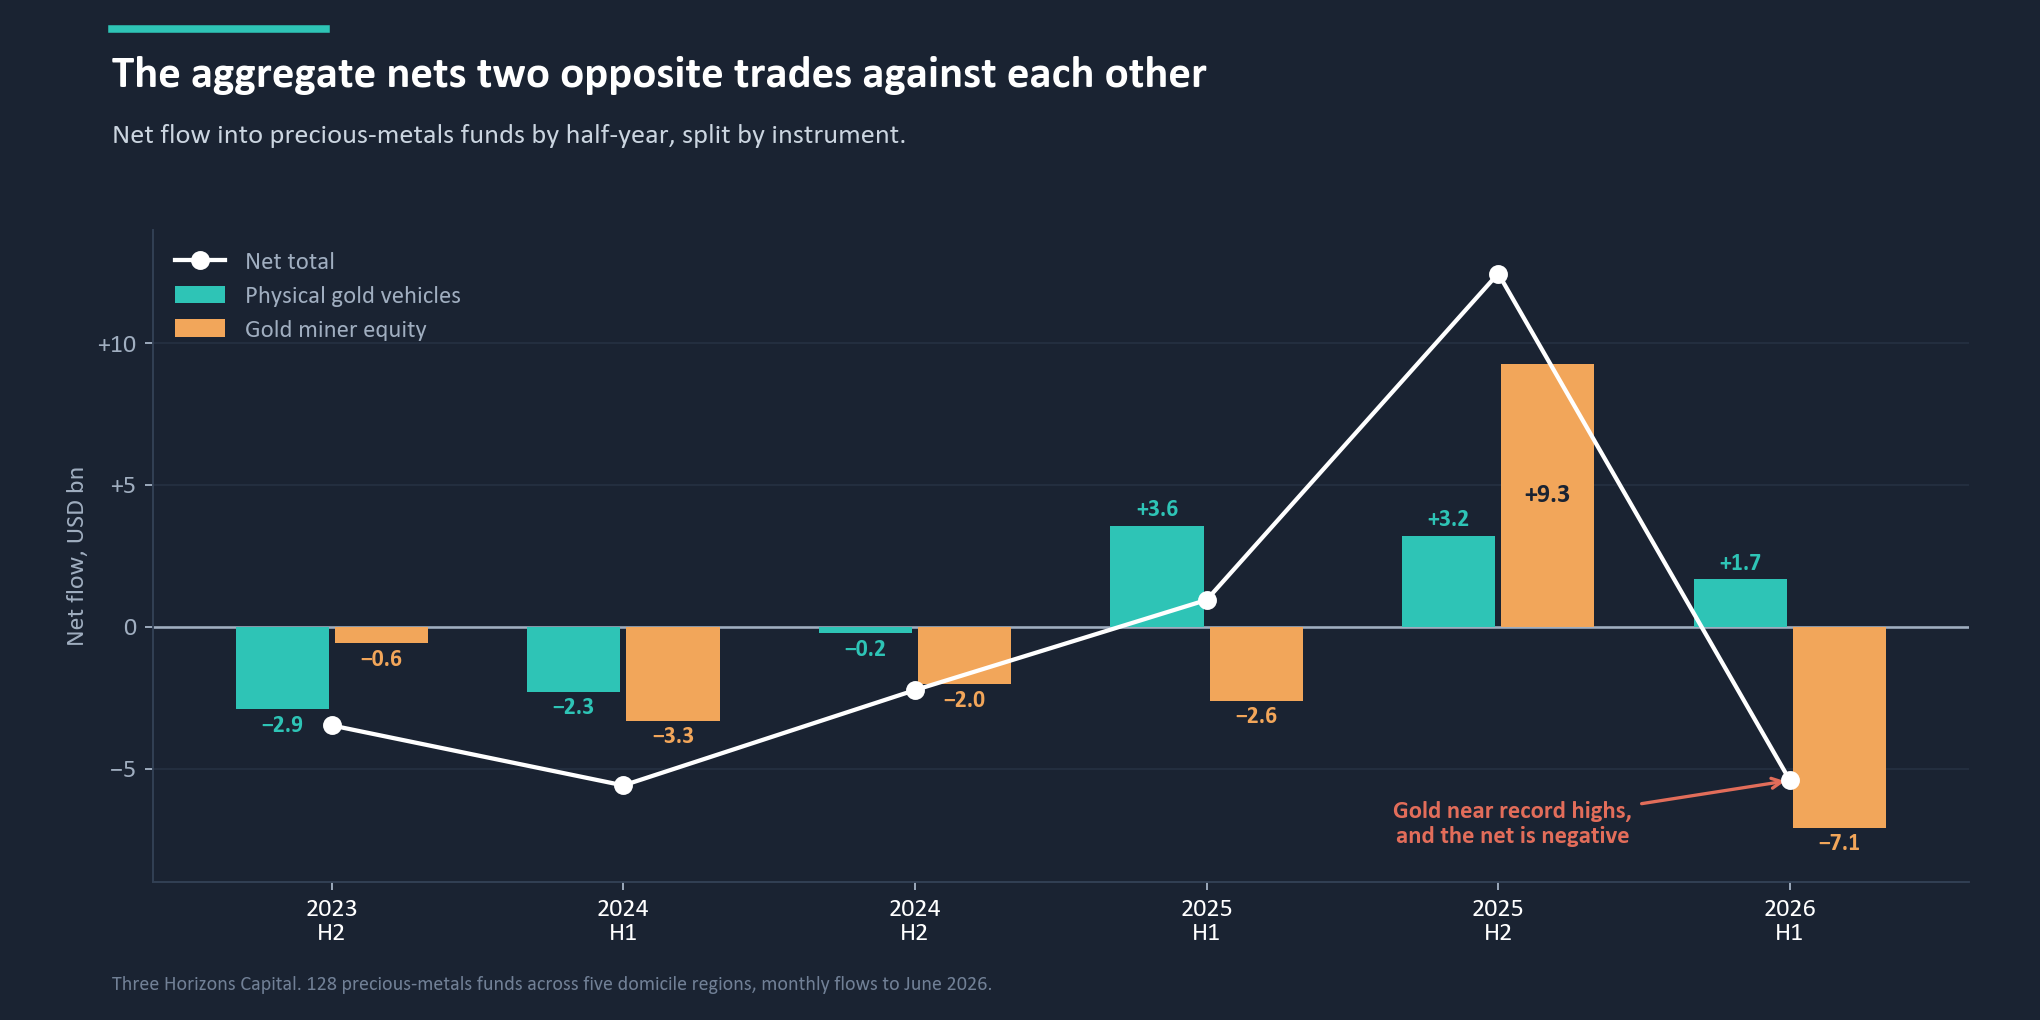
Split the same universe by instrument and the contradiction resolves immediately. In 2026 physical gold vehicles took in +$1.67 billion while gold miner equity funds lost −$7.08 billion. The headline is simply those two numbers colliding.
| Period | Physical | Miner equity | Net |
|---|---|---|---|
| 2024 H2 | −$0.22bn | −$2.01bn | −$2.23bn |
| 2025 H1 | +$3.55bn | −$2.60bn | +$0.95bn |
| 2025 H2 | +$3.19bn | +$9.26bn | +$12.45bn |
| 2026 H1 | +$1.67bn | −$7.08bn | −$5.41bn |
The net column is negative, then barely positive, then hugely positive, then negative again. A reader following only that column would conclude investors abandoned gold, returned, piled in, then abandoned it again. None of that happened. Physical gold has been in net inflow for six consecutive quarters. The entire swing belongs to the miner column. Across the full thirty-six months the two have gone in opposite directions: physical +$3.02 billion, miner equity −$6.31 billion.
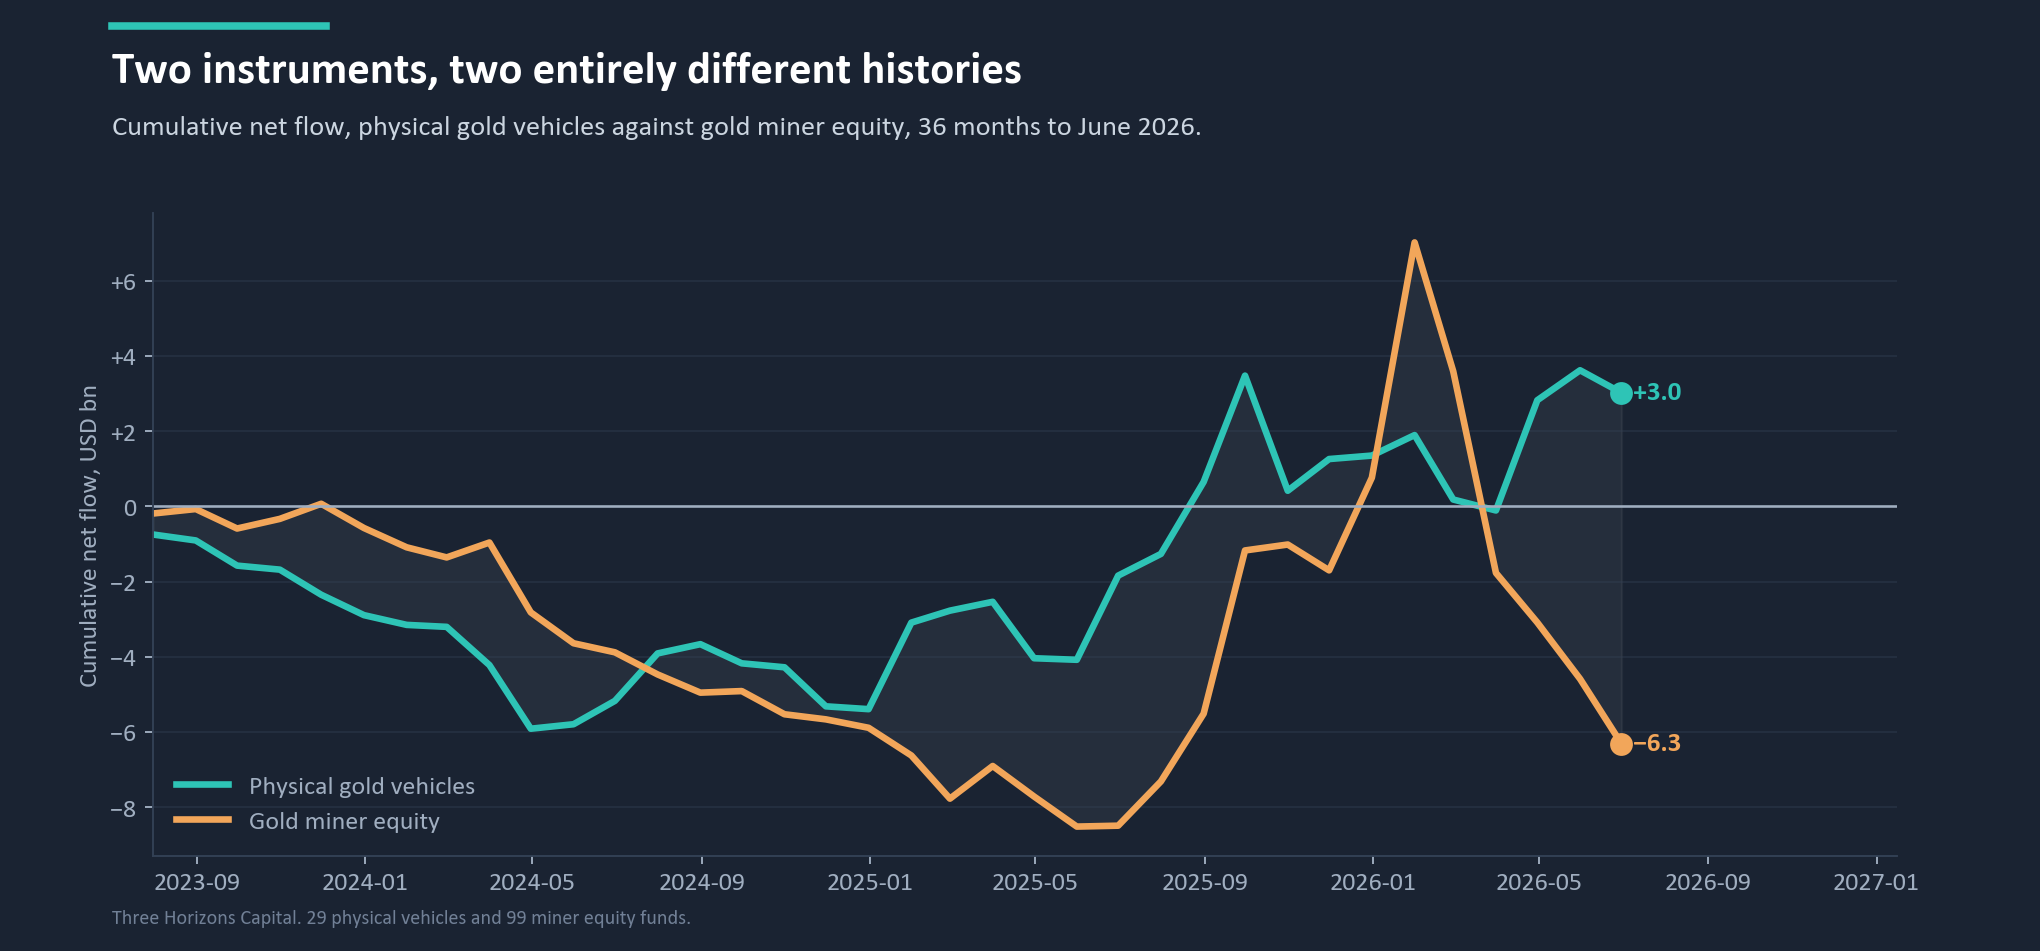
A miner is not leveraged gold. It is gold with four additional businesses stacked on top, each of which can fail independently of the metal: operating cost, jurisdiction, management execution, and equity beta. That last one matters most for portfolio purposes. Miners fall with the equity market in risk-off episodes, which is exactly when the metal is supposed to be earning its place.
What this tells you: The hedge and its proxy stop agreeing at the precise moment agreement is required. The durable recipient of capital across this cycle has been the vehicle carrying none of those four layers.
The cycle
The miner trade ran a full round trip and gave it all back in five months.
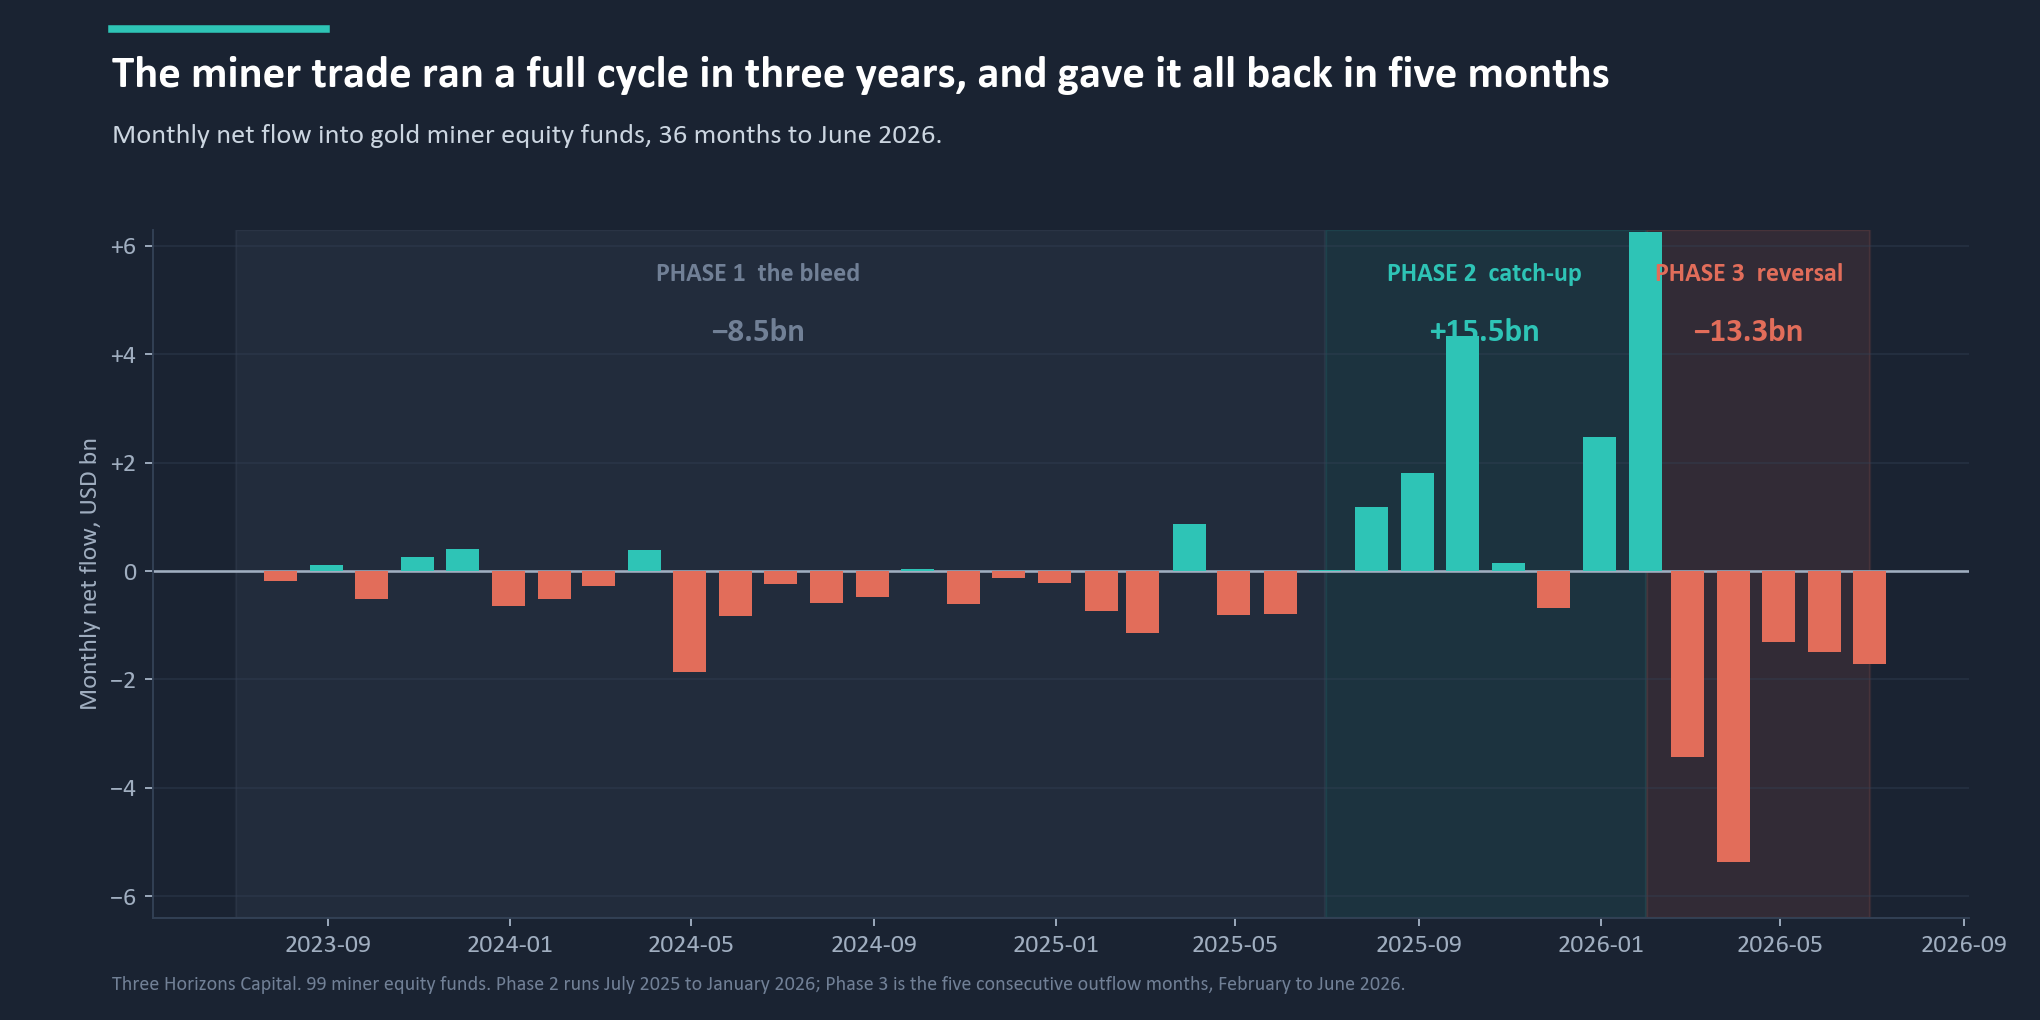
| Phase | Window | Net flow |
|---|---|---|
| One, the bleed | Jul 2023 to Jun 2025 | −$8.49bn |
| Two, the catch-up | Jul 2025 to Jan 2026 | +$15.51bn |
| Three, the reversal | Feb to Jun 2026 | −$13.33bn |
January 2026 alone brought in $6.26 billion, the largest single month in the dataset. The catch-up trade took two and a half years to set up, seven months to play out, and five months to unwind almost entirely. The money that arrived in January arrived at the top.
What this tells you: A position whose full round trip fits inside eighteen months, and whose worst five months erase seven good ones, is not a strategic holding. It can be an excellent trade. The flow pattern suggests many participants did not know which of the two they were making.
Geography
Three investor bases, and only one is still buying.
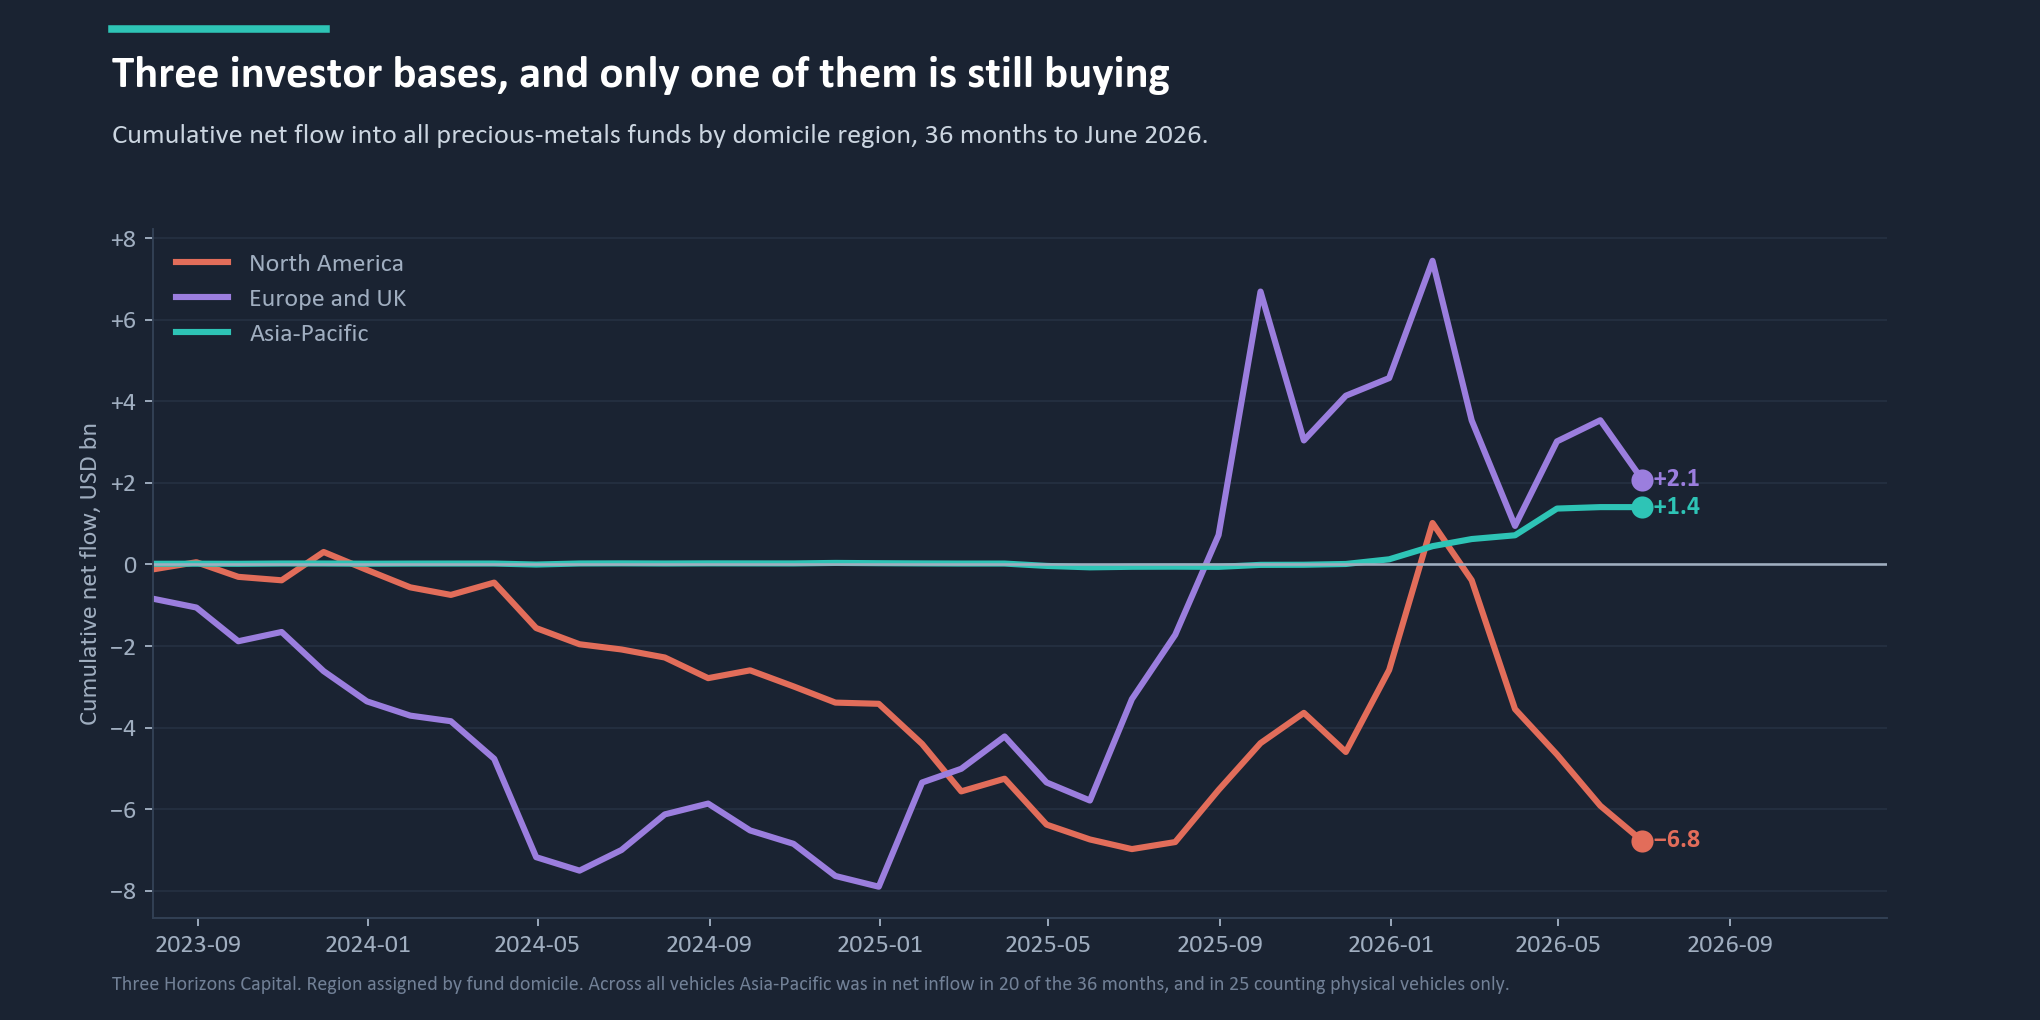
North America, −$4.19 billion in 2026. The largest and fastest-moving pool. It drove the miner catch-up late in the cycle and absorbed the full reversal. Momentum money on a horizon of months.
Europe and the UK, −$2.49 billion. The most complex of the three. Predominantly physical holders, but with sharp internal rotation and single months large enough to move the regional total on their own. Institutional money making individually large, individually idiosyncratic decisions.
Asia-Pacific, +$1.28 billion, and the only region in net inflow. The smallest pool by assets and the most consistent by direction. Its flow is almost entirely physical: miner equity in the region nets to roughly zero across the whole window. On that physical book it has been in net inflow in twenty-five of the last thirty-six months, and across all vehicles in twenty.
What this tells you: Western flows behave like a position that is entered and exited. The Asia-Pacific pattern behaves like accumulation that does not obviously respond to the price being high. A buyer who does not sell into strength is a different kind of buyer, and the two are being averaged into a single line called demand.
The finding
Strip out the news and Western money has been leaving gold for nine years.
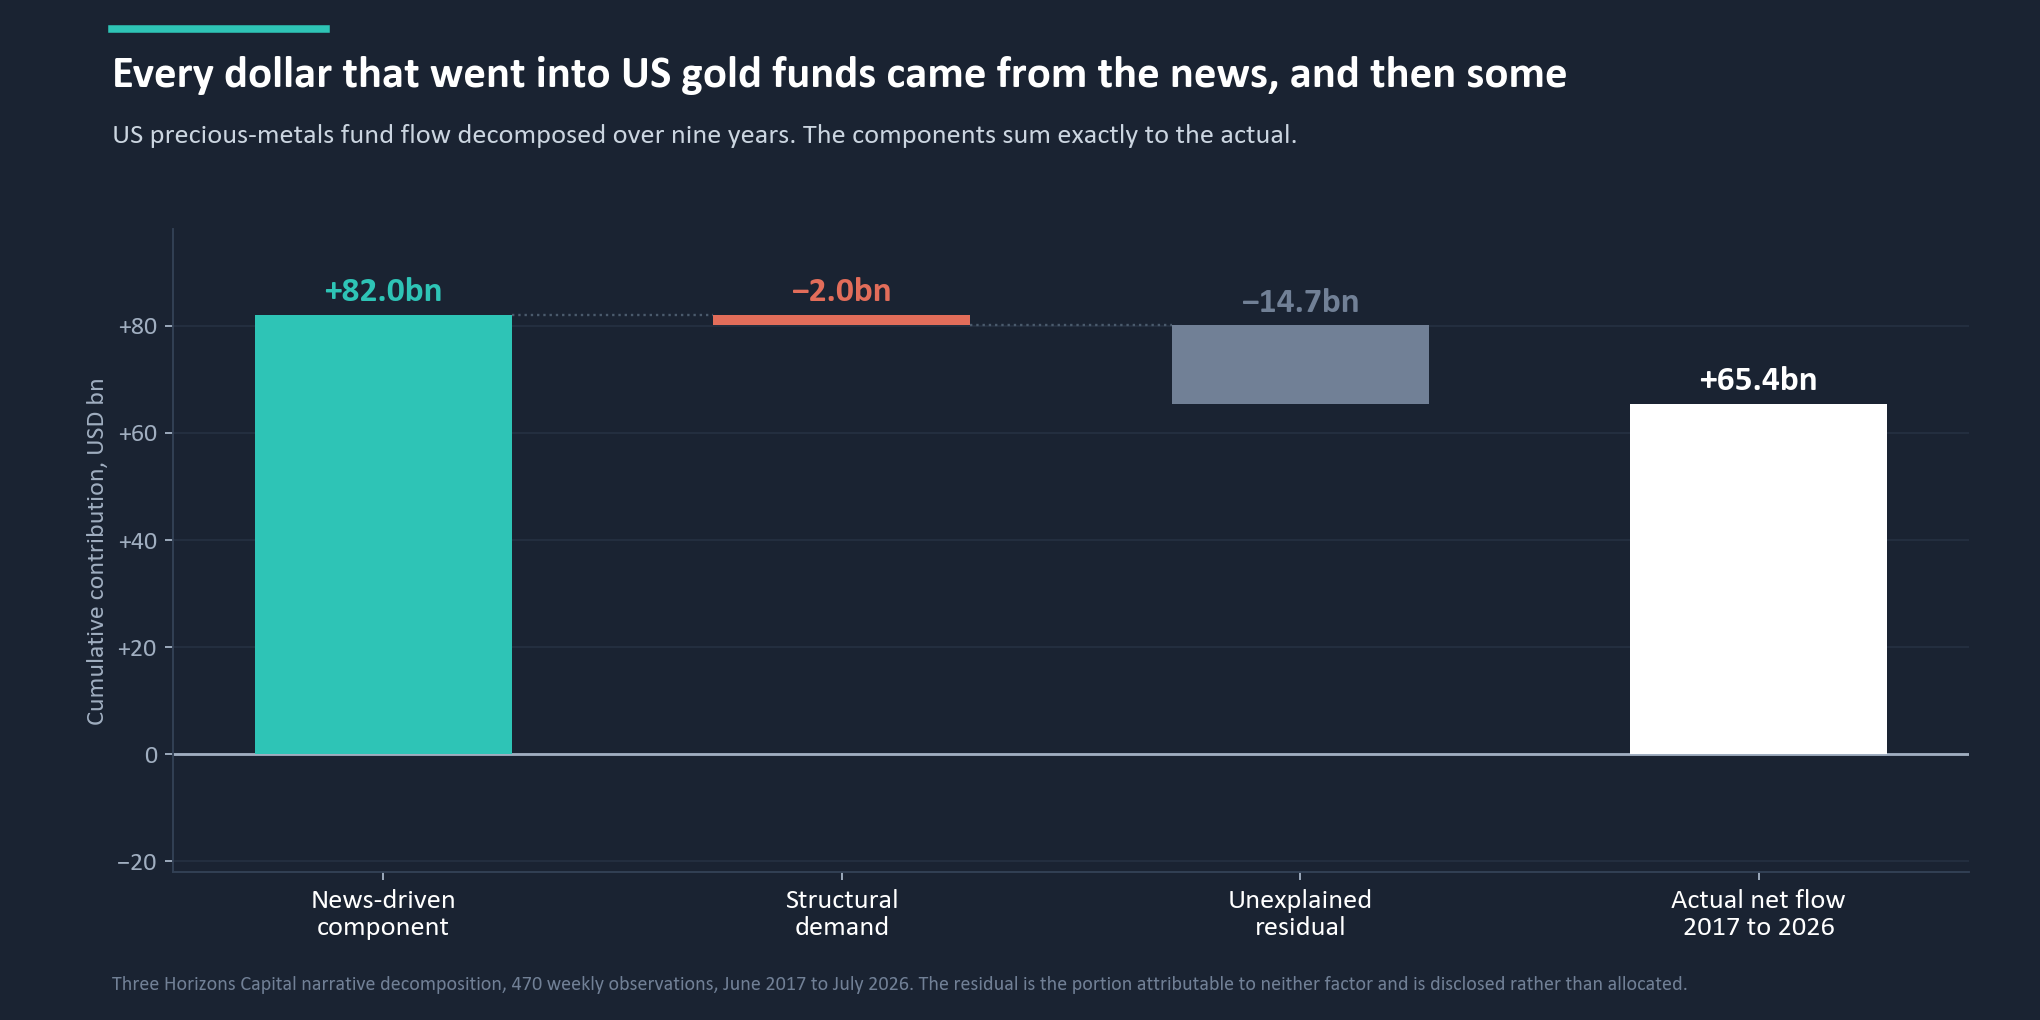
We separate weekly fund flow into three parts: a structural component, being the demand that persists when media attention is held constant; a news-driven component, moving with the intensity of media coverage; and a residual, being everything the model cannot attribute to either. The three sum exactly to the observed flow.
| Component | Cumulative 2017 to 2026 | Share of weekly variation |
|---|---|---|
| News-driven | +$82.0bn | 40.3% |
| Structural demand | −$2.0bn | 4.6% |
| Unexplained residual | −$14.7bn | 55.1% |
| Actual net flow | +$65.4bn |
The structural component is negative. Over nine years the demand that persists independently of the news cycle has subtracted two billion dollars from US gold funds, and it is negative in 57% of all weeks measured. Every dollar of the $65 billion that went in, and $17 billion more besides, is attributable to the news component and the residual.
Two honest qualifications, because this is the most load-bearing claim here. Gold is not unusual in being news-driven. Of the portion this model can attribute to one factor or the other, roughly nine-tenths of gold flow is news rather than structure, but run the same test across every other category and gold ranks twenty-second of eighty-seven. Almost all fund flow is news-driven and equity flows are more so. What distinguishes gold is not that the news share is high. It is that there is nothing underneath it.
And the residual is the largest single share of week-to-week variation, at 55%. We publish that rather than bury it. A decomposition explaining less than half of short-run variation should not be read as a precise weekly signal; the finding rests on the nine-year cumulative direction. One further note against our own argument: over the most recent twelve months the structural component has turned positive, by roughly $2.6 billion on a trailing twelve-month basis. That is either the start of a genuine regime change or the model reading a sustained news environment as structure, and it is too early to know which.
The gap
The price is being set by buyers who never appear in this data at all.
Western fund flows in 2026 are net negative. Miner equity is in heavy outflow. The structural component of Western demand is a nine-year drain. And the gold price is near an all-time high. Those facts reconcile in only one way. The marginal buyer setting the price is not in this dataset.
Reserve managers have been net buyers of gold for sixteen consecutive years on World Gold Council figures, with 2026 purchases estimated at roughly 850 tonnes. These are third-party estimates rather than our data and we flag them as such, but the relevant point is structural: this is price-inelastic demand driven by reserve policy, not by the gold price or by anything in the news cycle, and it does not transact through the vehicles a Western flow screen measures. The Asia-Pacific pattern visible in our own data is the small, measurable tip of a behaviour that largely happens outside pooled funds entirely.
What this tells you: The metric is structurally blind to the buyer that matters. It shows Western sentiment accurately and in high resolution, and tells you almost nothing about the bid actually setting the price. A Western fund outflow is visible weeks ahead; a change in reserve policy would not register until well after the price had moved. The absence of early warning is itself a risk, and it is carried by everyone who owns the metal.
What to do with it
An allocation that does not specify instrument, geography and catalyst is not a thesis.
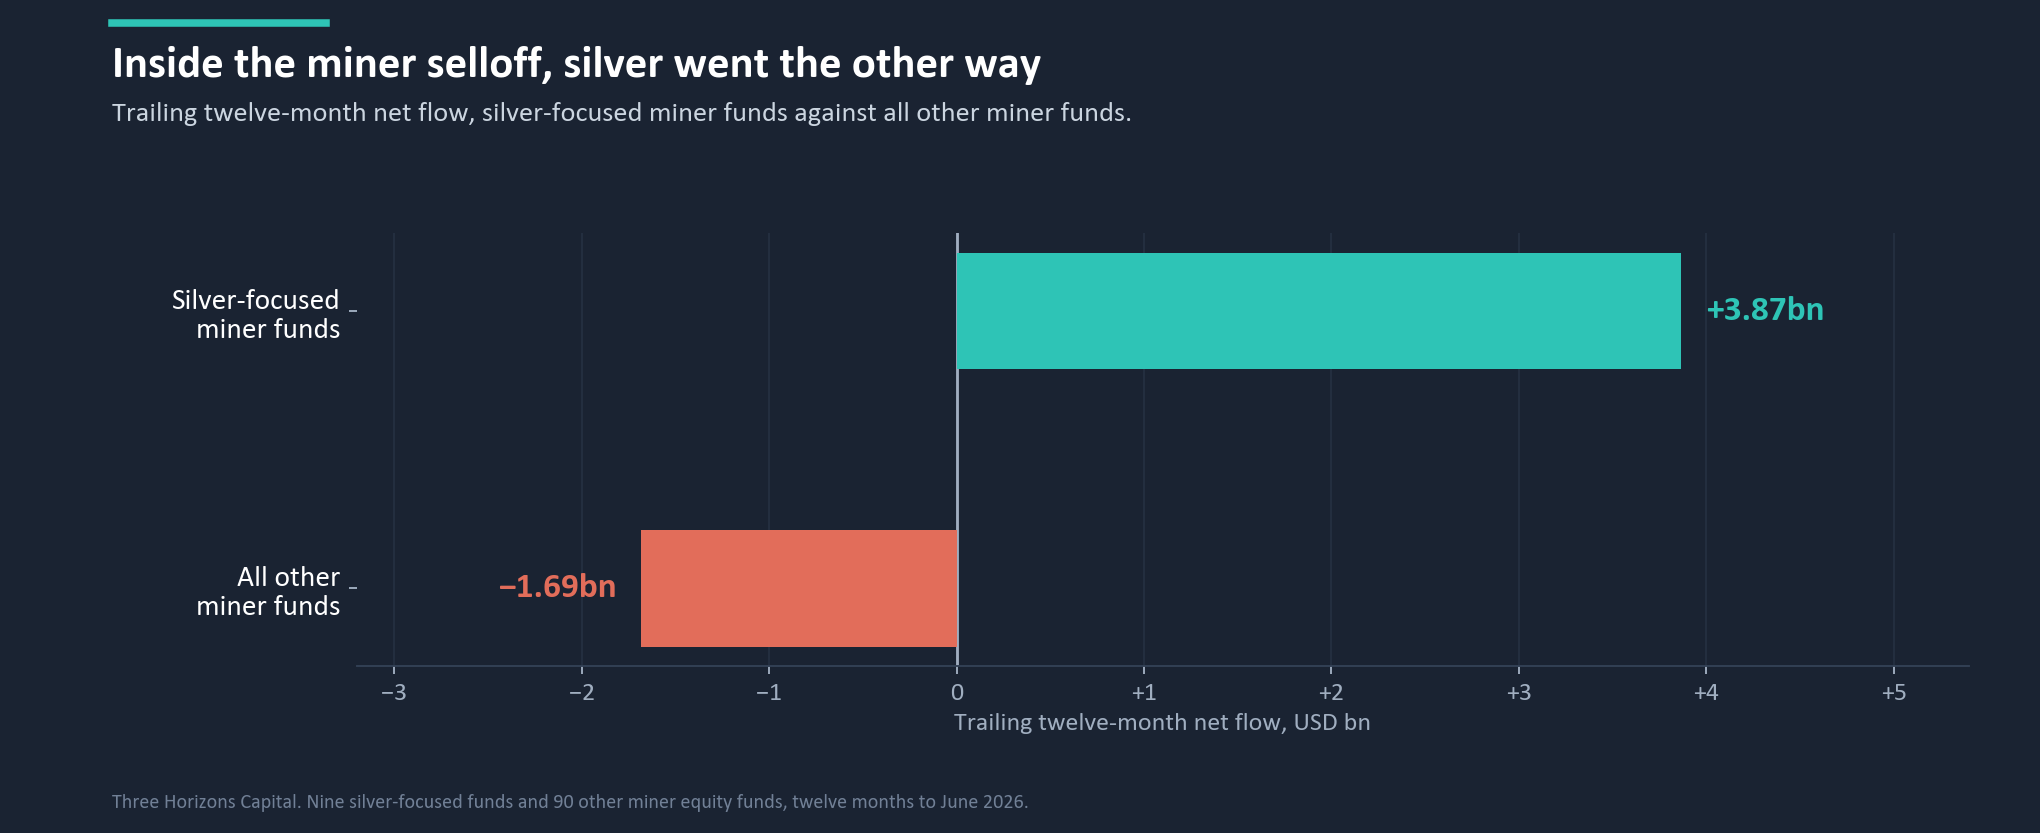
One last piece of evidence for how finely this splits. Inside the miner selloff, silver-focused miner funds took in $3.87 billion over the trailing year while every other miner category lost $1.69 billion. Within an instrument in heavy net outflow, a sub-segment was in heavy net inflow, driven by a relative-value view on the gold-to-silver ratio and an industrial demand story with nothing to do with the monetary case for gold.
Same metal, opposite flows, at four levels of resolution. Which means “we are adding gold” is not a decision. It is a category. Three questions turn it into a thesis. Which instrument, because if the reason for holding gold is that it behaves differently from equities under stress, miner equity does not do that, because it is equity. Which geography, because that determines whether your fellow holders are central banks on a horizon of years or momentum traders on a horizon of months whose exit becomes your drawdown. And is the catalyst a headline or a structure, because a position sized for a monetary thesis and entered on a headline is two different trades wearing the same ticker.
The thread
The number on the page is usually measuring something narrower than its name.
Four pieces now, and the same discipline underneath all of them. The first found portfolios that had become a single trade without anyone deciding to. The second found that the most popular remedy was a different expression of the same trade. The third found that the sleeve held for protection had stopped protecting, and that the industry's own assumptions already knew. This one finds an asset where the aggregate everybody quotes is the average of three contradictory behaviours, and where the buyer setting the price does not appear in the data at all.
None of this argues against owning gold. The monetary case is intact and the buyer base beneath it is more durable than the one that left. It argues against owning “gold” as an undifferentiated idea. There is a monetary position, a leveraged operating bet, and a relative-value trade, and they happen to share a metal. Decide which one you are making.
Sources, scope and what is not here
One hundred and twenty-eight distinct precious-metals funds across four third-party fund categories, covering physical exchange-traded commodities and physical ETFs, miner exchange-traded funds, and actively managed miner mutual funds, across North America, Europe and the UK, and Asia-Pacific. Monthly net flows, thirty-six months from July 2023 to June 2026. The narrative decomposition is weekly, 470 observations from June 2017 to July 2026, US precious metals. No fund, provider or ticker is named anywhere in this piece. Net flow attached to a single share class can differ materially from the same provider's position across all its share classes; in one case examined during preparation, a vehicle showing roughly a billion dollars of outflow belonged to a provider whose physical gold complex had lost close to nothing once its currency-hedged classes were included. Naming individual vehicles would risk characterising a firm by an artefact of share-class structure, so we describe the pattern instead. No gold price level is quoted; nothing in the argument depends on one. Central bank demand figures are third-party estimates from the World Gold Council and are identified as such. Asia-Pacific month counts depend on vehicle scope and both are stated wherever the frequency is used. Past flow patterns are not indicative of future flows or returns. For professional investors; not investment advice.