The question
The answer is to move down the stack.
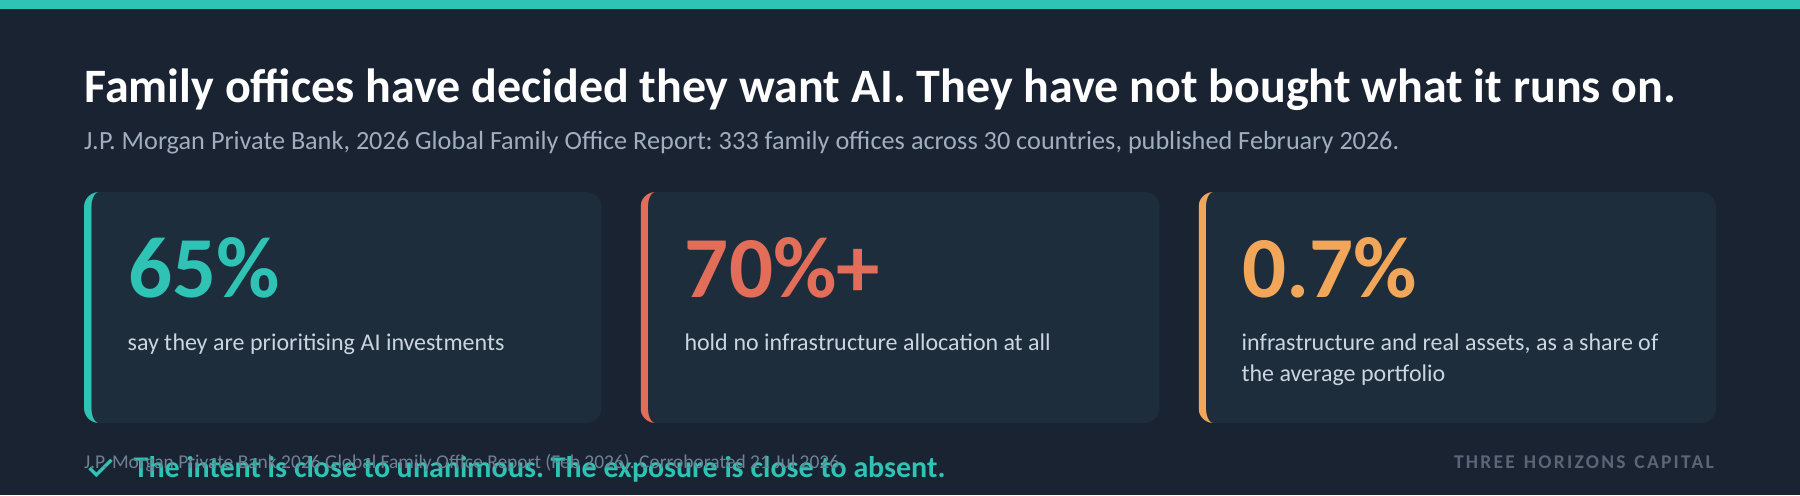
Our previous piece measured portfolios that had become a single trade by accident. The question that came back from allocators was the practical one. In J.P. Morgan Private Bank's 2026 Global Family Office Report, covering 333 offices, 65% say they are prioritising AI investments and more than 70% hold no infrastructure allocation at all. Infrastructure and real assets come to 0.7% of the average portfolio. The intent is nearly unanimous and the exposure is nearly absent.
If you do not want to pick between laboratories, stop buying the model layer and buy what the model layer runs on. AI compute is an energy problem wearing a semiconductor costume. The constraint is not chips. It is watts. A current-generation NVIDIA GB200 NVL72 rack draws roughly 120 kilowatts; a legacy enterprise rack draws five to ten.
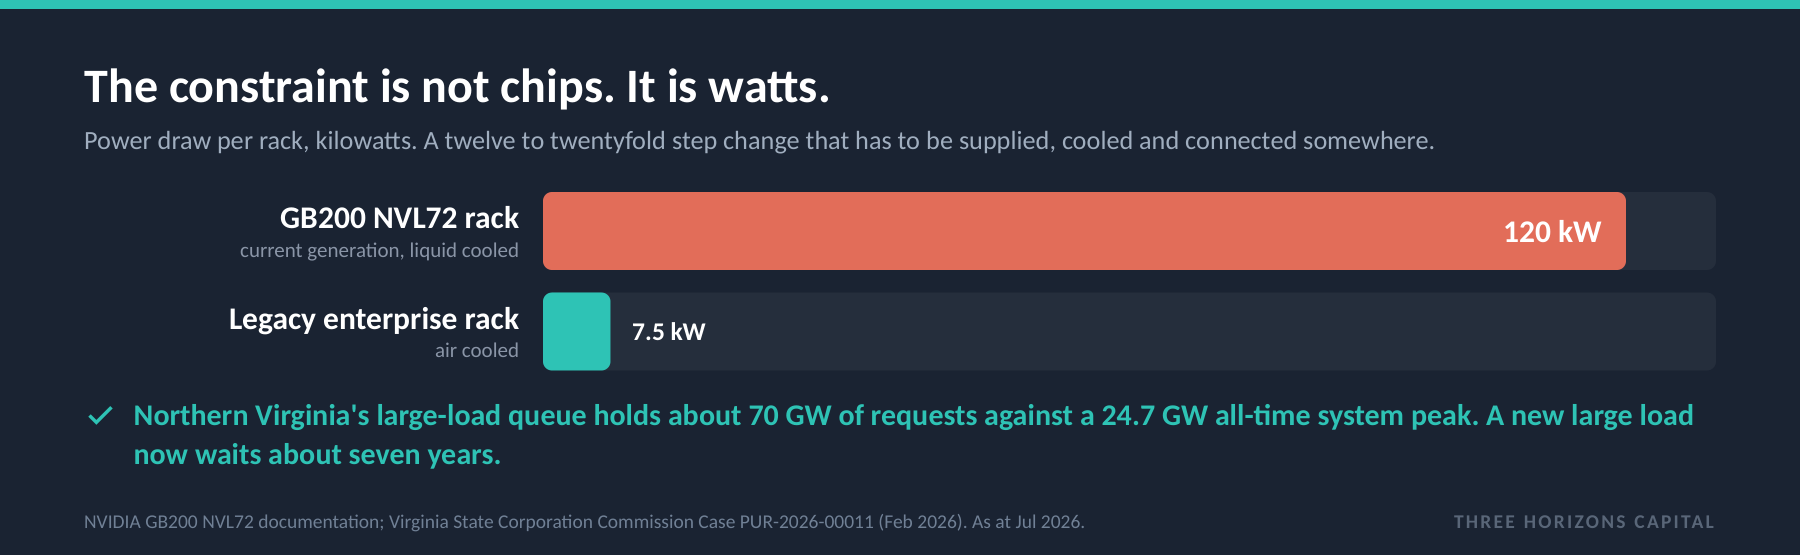
Those places are running out. Northern Virginia's large-load interconnection queue holds around 70 gigawatts of requests against an all-time system peak of 24.7 gigawatts, and a new large load waits about seven years. CBRE has North American primary-market vacancy at a record low of 1.4%, Northern Virginia at 0.3%, with roughly 80% of space under construction already pre-leased. The four largest hyperscalers are on track for roughly $700bn of capital expenditure in 2026, and three of the four raised guidance in the first quarter. The most under-owned layer is power: most family offices holding anything here hold the data centre REIT and the semiconductor name and stop. Almost nobody owns the grid.
What it genuinely buys you
It removes selection risk, and that is not a small thing.
You no longer need to be right about which laboratory wins, which architecture prevails, or which model is state of the art in three years. The landlord is paid by whoever signs the lease. The utility is paid by whoever draws the power. You have swapped a binary bet on companies for a claim on the physical plant all of them need, and picked up contracted, often inflation-linked cash flows along the way. That is a real improvement over buying the model layer directly, and anyone telling you otherwise is not paying attention.
But removing selection risk is not the same as removing risk, and the difference is where this piece earns its keep.
The distinction
There are two kinds of AI infrastructure.
AI-enabler infrastructure is paid if the build continues: data centre REITs, liquid cooling and plant, development-stage private equity, advanced packaging and wafer fabrication equipment. Its cash flows are a function of hyperscaler capital expenditure. AI-agnostic infrastructure is paid regardless: regulated transmission and distribution serving all load, existing generation under long-dated contract, water, ports, toll roads. Its cash flows are a function of an economy existing.
Both sit under the same heading. Only the second is a diversifier. And the distinction is not academic: rank every asset class in the book by how hard a hyperscaler pullback hits it, and the four buckets the AI tilt bought are the four worst-hit. Not roughly. Exactly, with a clear gap to the fifth.
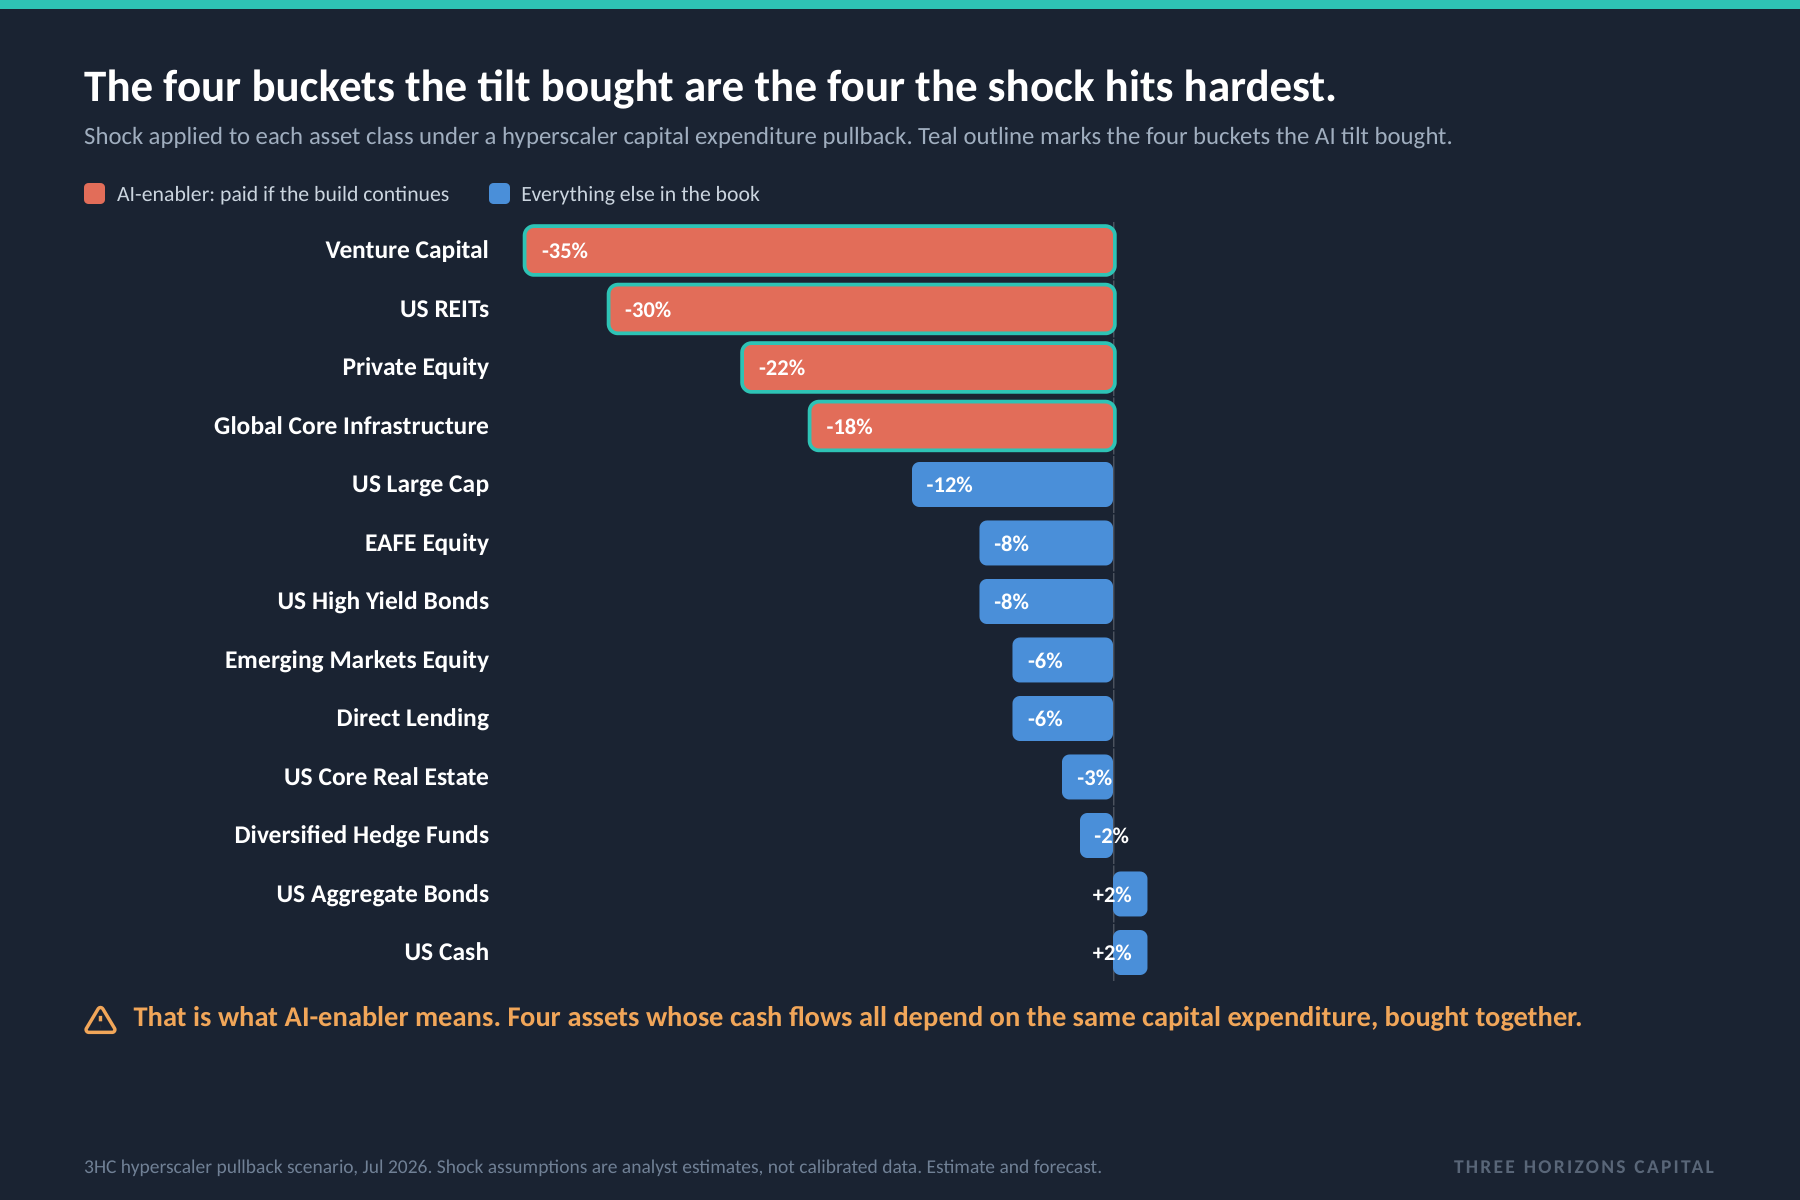
What this tells you: That is what AI-enabler means in practice. Four assets bought together whose cash flows all depend on the same capital expenditure. Diversified by asset class on the statement, one dependency underneath.
The build
So we built the enabler-heavy version and measured it.
Fifteen percentage points out of generic large-cap equity, core bonds and traditional real estate, into data centre REITs, global core infrastructure, private equity and venture. Against the J.P. Morgan 2026 long-term capital market assumptions it does what the story promises. Expected annual return goes from 7.10% to 7.35%, volatility from 11.61% to 12.26%, and concentration in a single growth factor comes down from 95.9% of variance to 93.8%. It also holds up better in five of six standard stress tests.
That last sentence is the one we would normally have led with. It is also the one that turned out not to mean anything.
The catch
The stress test was not looking at what we bought.
The six standard macro scenarios shock US large cap, emerging market equity, core real estate, aggregate bonds, high yield, hedge funds and cash. They apply no shock at all to listed REITs, private equity, direct lending, EAFE equity, global core infrastructure or venture capital. Not in most of the six scenarios. In none of them. Those six asset classes have no rows in the shock table at all.
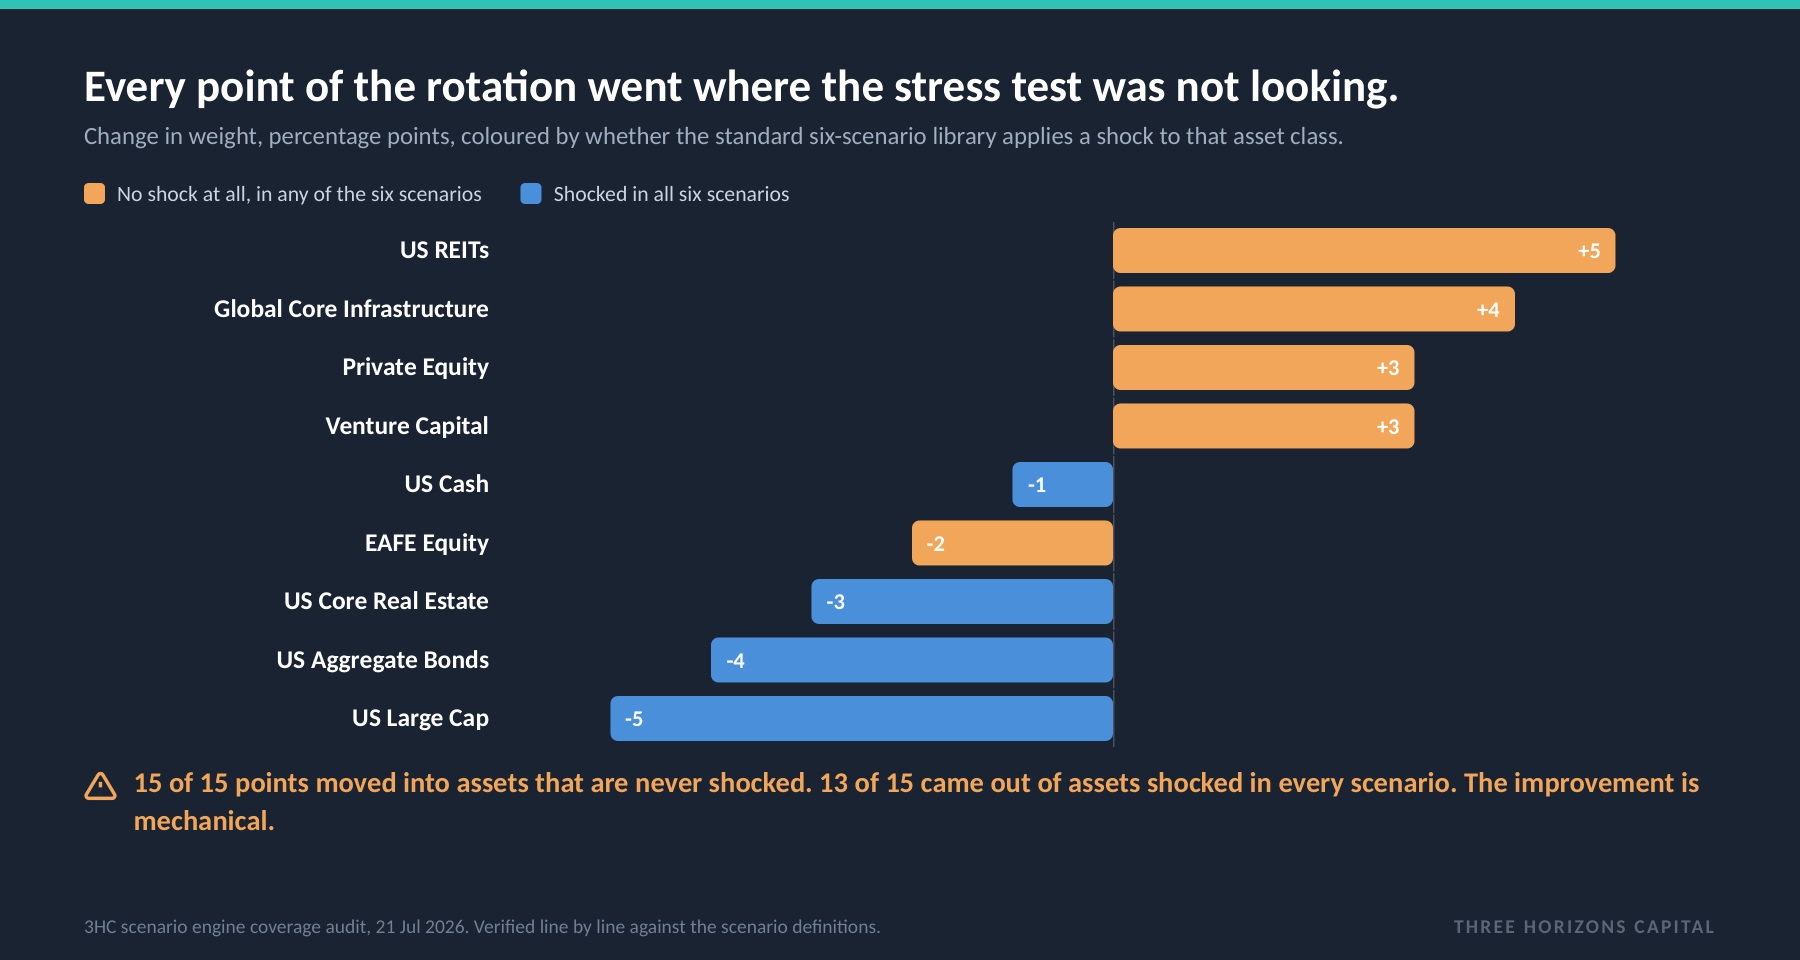
Every single percentage point of the rotation went into a bucket the scenario library never shocks. Eighty-seven percent of what funded it came out of buckets it shocks in every scenario. The portfolio did not become more resilient. It moved its money to where the stress test was not looking.
What this tells you: This is not a quirk of one model. Scenario libraries are built from public-market history, so private and real assets get muted shocks or none. The structural consequence is that a standard stress test will tend to reward any move from public into private. If you have been shown one that says your private-heavy reallocation improves your worst case, this is the first thing to check.
The test that mattered
So we built the one that was missing.
The risk the original framework named was not a generic recession. It was a pullback in hyperscaler capital expenditure. That scenario did not exist in the library, so we built it, shocking each bucket by how directly its cash flows depend on that capital expenditure continuing. The full shock vector is published in the paper so it can be reproduced or disputed.
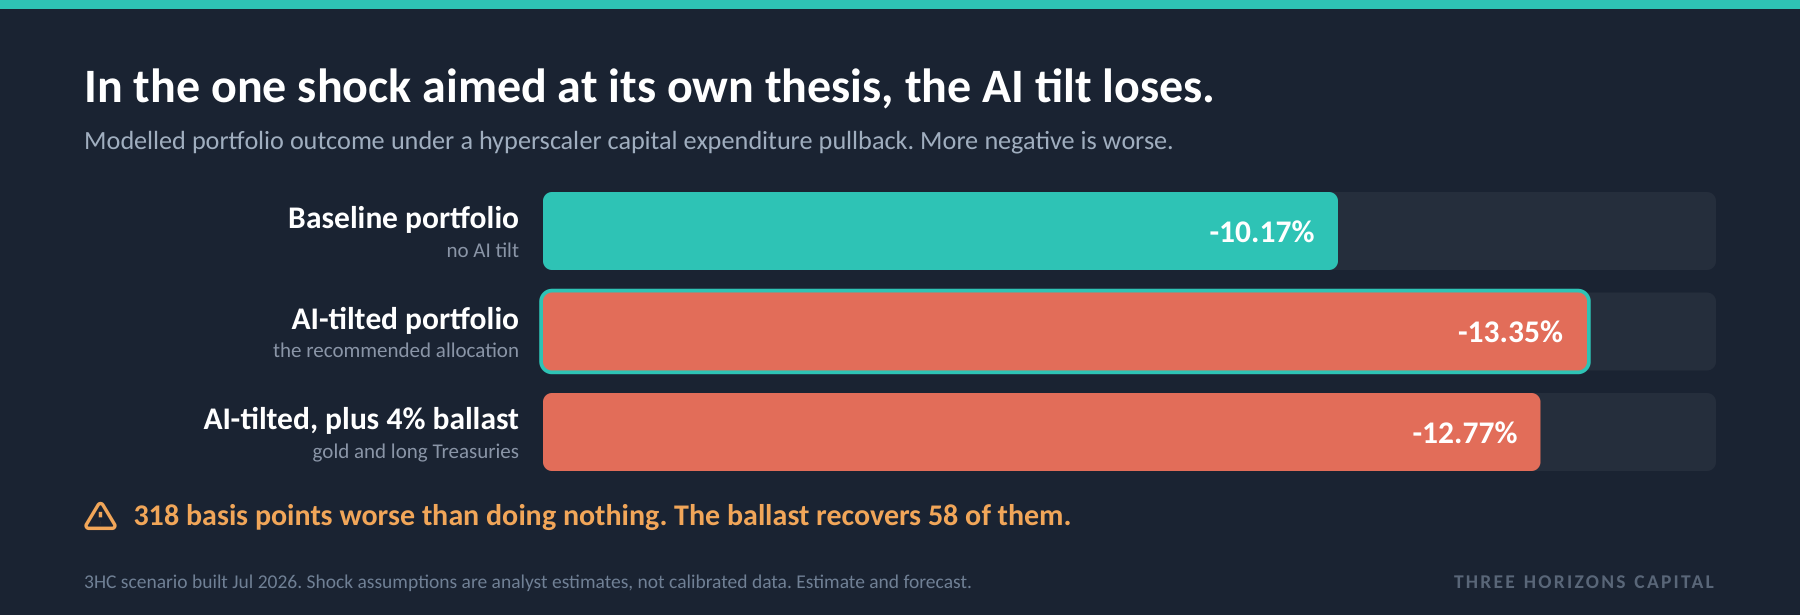
The result is the opposite of the story. The baseline book falls 10.17%. The AI-tilted book falls 13.35%, a gap of 318 basis points. The concentration risk flagged at the outset was real, and larger than anyone had assumed. Adding four points of gold and long Treasuries takes the tilted outcome to 12.77%, recovering 58 of those 318 basis points and leaving the tilt still 260 behind the baseline. It also barely touches the factor concentration, moving the growth share from 93.78% to 93.43%. Ballast is worth holding for an ordinary drawdown. It is not an antidote to this.
What it means
Indirect is not diversified.
The tilt did remove selection risk. You are no longer betting on which laboratory wins. What it did not do is reduce your dependency on the build continuing. You swapped which company wins for whether the build goes on. That is a different risk, often a better one, but it is a different expression of the same outcome, not an offset to it. Indirect describes how you hold the exposure. Diversified describes whether you have less of it.
And nobody is starting from a clean sheet. If you held no AI exposure at all, an enabler-heavy allocation would be a perfectly sensible, cash-flow-backed way into the theme, and we would say so without qualification. But we measured what Western books already hold, and they are already long this outcome through the mega-cap complex, in size, by default. For that reader, adding enabler infrastructure is not diversifying into the theme. It is concentrating further into a dependency they already have and mostly did not choose.
What actually diversifies
Mix the enabler with the agnostic.
If the infrastructure sleeve is entirely data centres, cooling and development equity, it is an AI position with an infrastructure label. Regulated networks, contracted existing generation, water and transport carry the characteristics people actually want, contracted and inflation-linked cash flow, without the capital expenditure dependency riding underneath. Prefer layers where the constraint is physical and the counterparty is not a single theme: transmission that serves all load is a different asset from a data centre that serves one tenant. Watch the entry point, because listed proxies are priced for the benign case while private power and fibre still carry an illiquidity premium. And price the lock-up honestly: counting only genuinely locked vehicles, the tilt takes the book from 24% to 34% in capital you cannot readily retrieve.
The bottom line
The test you do not run is the risk you do not see.
We could have published the first version of this. Return up twenty-five basis points, growth concentration down two percentage points, better in five of six stress scenarios. Every number in that sentence reproduces exactly against the model. It would have been a good-looking piece and it would have been wrong, because the scenarios did not examine the assets the portfolio had just bought. The correction did not come from better data. It came from taking a risk that had already been flagged in a footnote and asking what it was actually worth, then building the test that would answer.
Two pieces, one discipline. The first found portfolios that had become a single trade without anyone deciding to. This one finds that the most popular remedy is a different expression of the same trade, and that the standard stress test will congratulate you for buying it. Measure the exposure you have, then test it against the thing that would actually hurt it rather than whichever scenarios happen to be available.
Sources: J.P. Morgan Private Bank, 2026 Global Family Office Report, February 2026 (333 offices, 30 countries); BNY Wealth, 2025 Investment Insights for Single Family Offices (282 single family offices); NVIDIA GB200 NVL72 product documentation; Virginia State Corporation Commission, Case PUR-2026-00011, February 2026; CBRE North American data centre trends, 2026; hyperscaler capital expenditure from company disclosures, first quarter 2026. Portfolio construction, forward analytics, factor decomposition and scenario outcomes computed against the J.P. Morgan 2026 Long-Term Capital Market Assumptions (USD, 58-asset covariance matrix), reproduced live 21 July 2026. Those assumptions are a third-party forecast over a horizon longer than the five to seven year planning horizon used here, and are not a forecast by Three Horizons Capital. The hyperscaler capital expenditure pullback scenario was constructed by Three Horizons Capital; its shocks are analyst assumptions and are not calibrated to historical data, and the full shock vector is published in the paper. Private-asset volatilities are as published and are not adjusted for appraisal smoothing, so risk in the private sleeves is likely understated. Market figures as at July 2026. For research and platform-demonstration purposes; not investment advice. Asset classes and vehicles named are examples, not recommendations.