You do not have to believe AI is a bubble to have a problem. You only have to look at what you already own. The exposure is not a view you took; it is arithmetic. The ten largest positions in the S&P 500 now account for 37% of the entire index, and every one of them is the same trade: the chipmakers, the hyperscalers and the platforms building artificial intelligence. The same handful of names sits at the top of the "total market" fund, the "global" fund and the "growth" fund alike.
This audit bypasses the valuation debate entirely. It does not argue whether those companies are worth their price. It measures something more useful and less contestable: how much of one trade a typical Western wealth portfolio actually holds, once you unwrap the labels. Where we measure position by position, we use US wealth-manager filings, the only market with holdings disclosure; the fund-level findings hold for any allocator, and the European picture, inferred from fund flows, points the same way.
The market
The market has become one trade, and you did not choose it.
This is not a sector tilt an investor opted into; it is the structure of the index itself. A market-cap fund holds companies in proportion to their size, and a handful of AI-era names have grown so large that owning the market now means owning them. NVIDIA alone is nearly 8% of the S&P 500; add Apple, Microsoft, Amazon, Alphabet, Broadcom, Meta and Tesla and roughly 37 cents of every dollar in the index sits in one theme.
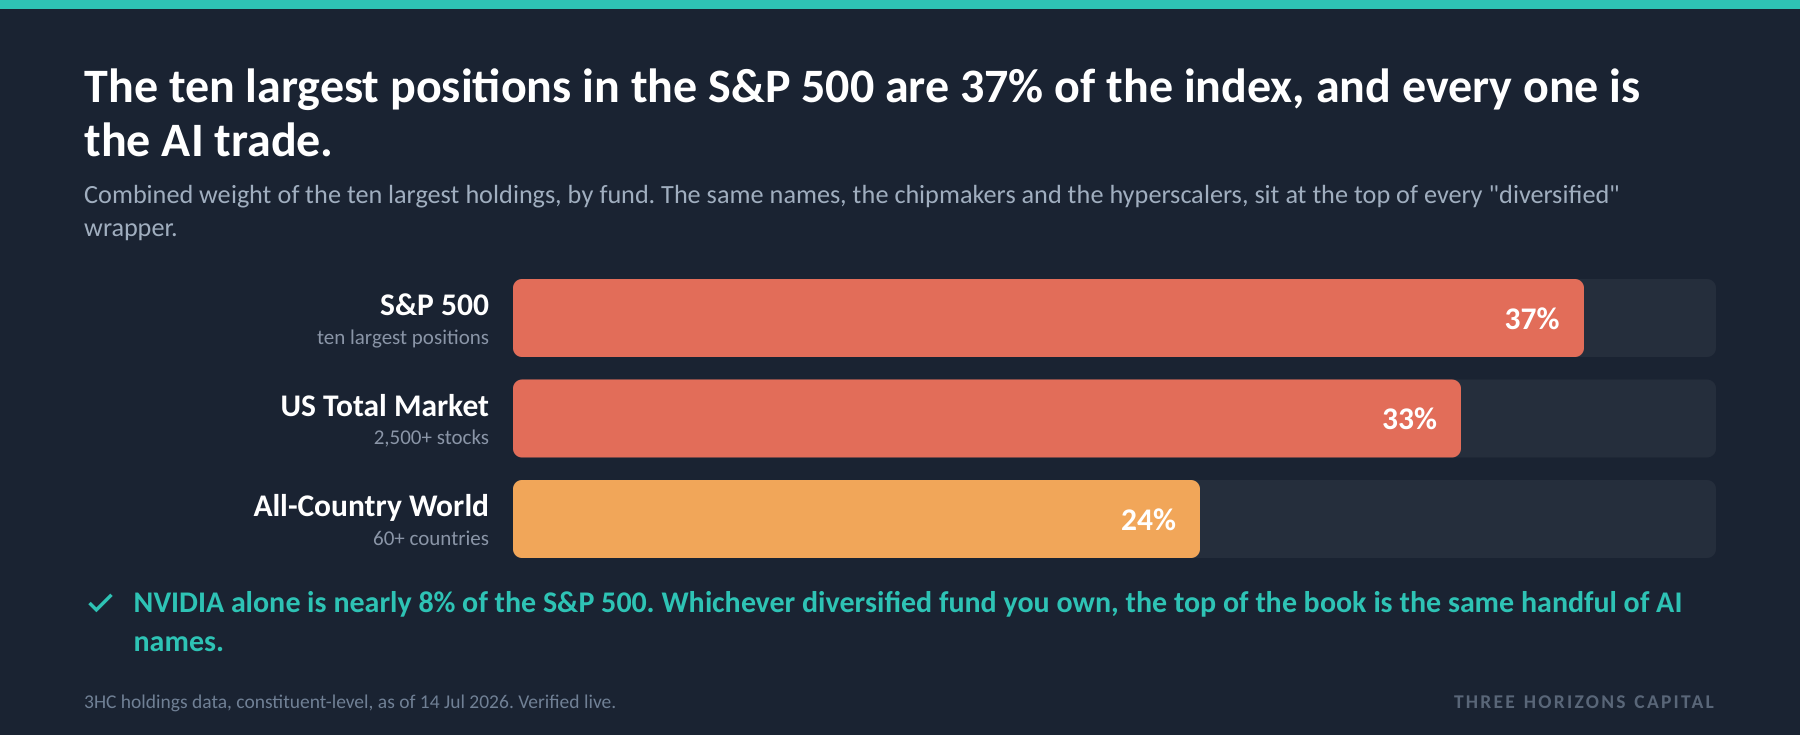
The concentration does not stay inside the S&P 500. The same names top a total US market fund of more than 2,500 stocks, where they are still a third of the money, and an all-country world fund spanning more than 60 countries, where they are close to a quarter, joined only by Taiwan Semiconductor, the same trade in a different domicile. The geography on the label changes; the top of the book does not.
The crowding
You are concentrated in exactly those assets.
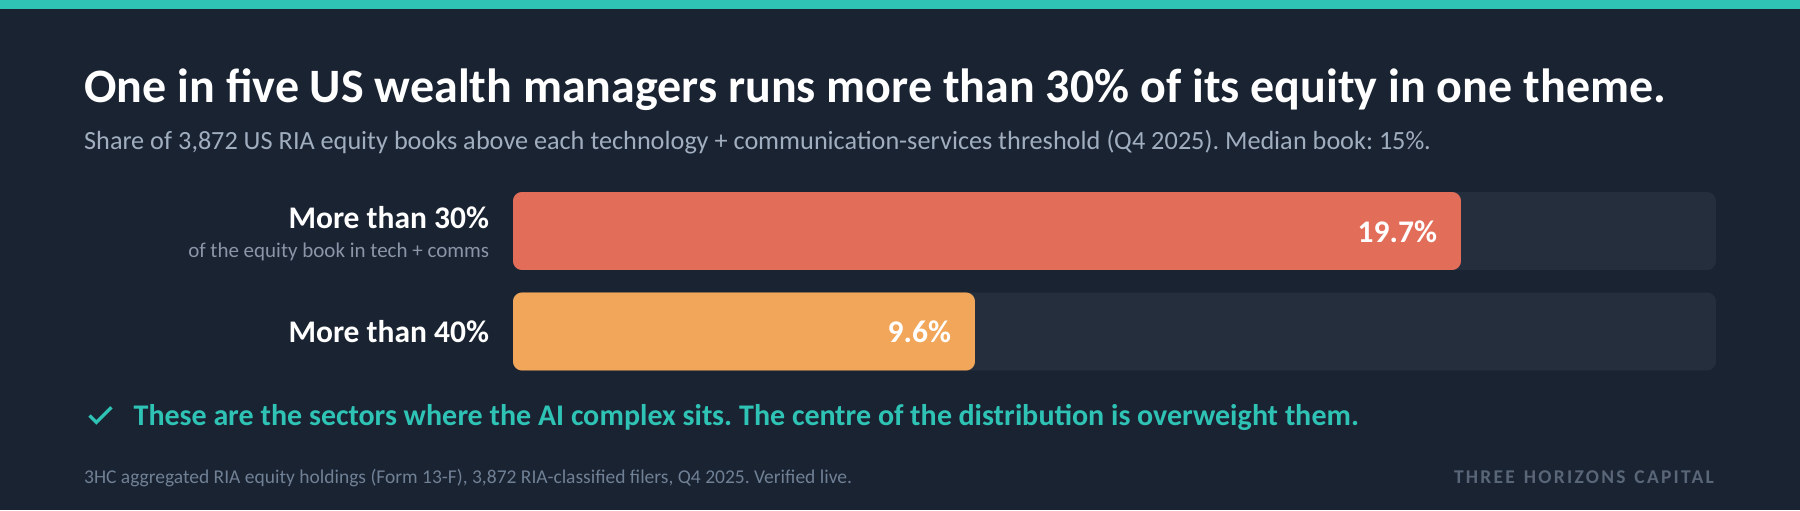
Across 3,872 US RIA equity books, the median holds roughly 15% in technology and communication services, and under 1% in energy. Roughly one in five runs more than 30% in that cluster, the sectors where the AI complex lives. And it is intensifying: over the year to June 2026, growth mutual funds shed about $245 billion while technology ETFs took in close to $75 billion, a rotation deeper into the trade, not away. European-domiciled funds are buying the same technology ETFs; this is not a US-only pattern.
The illusion
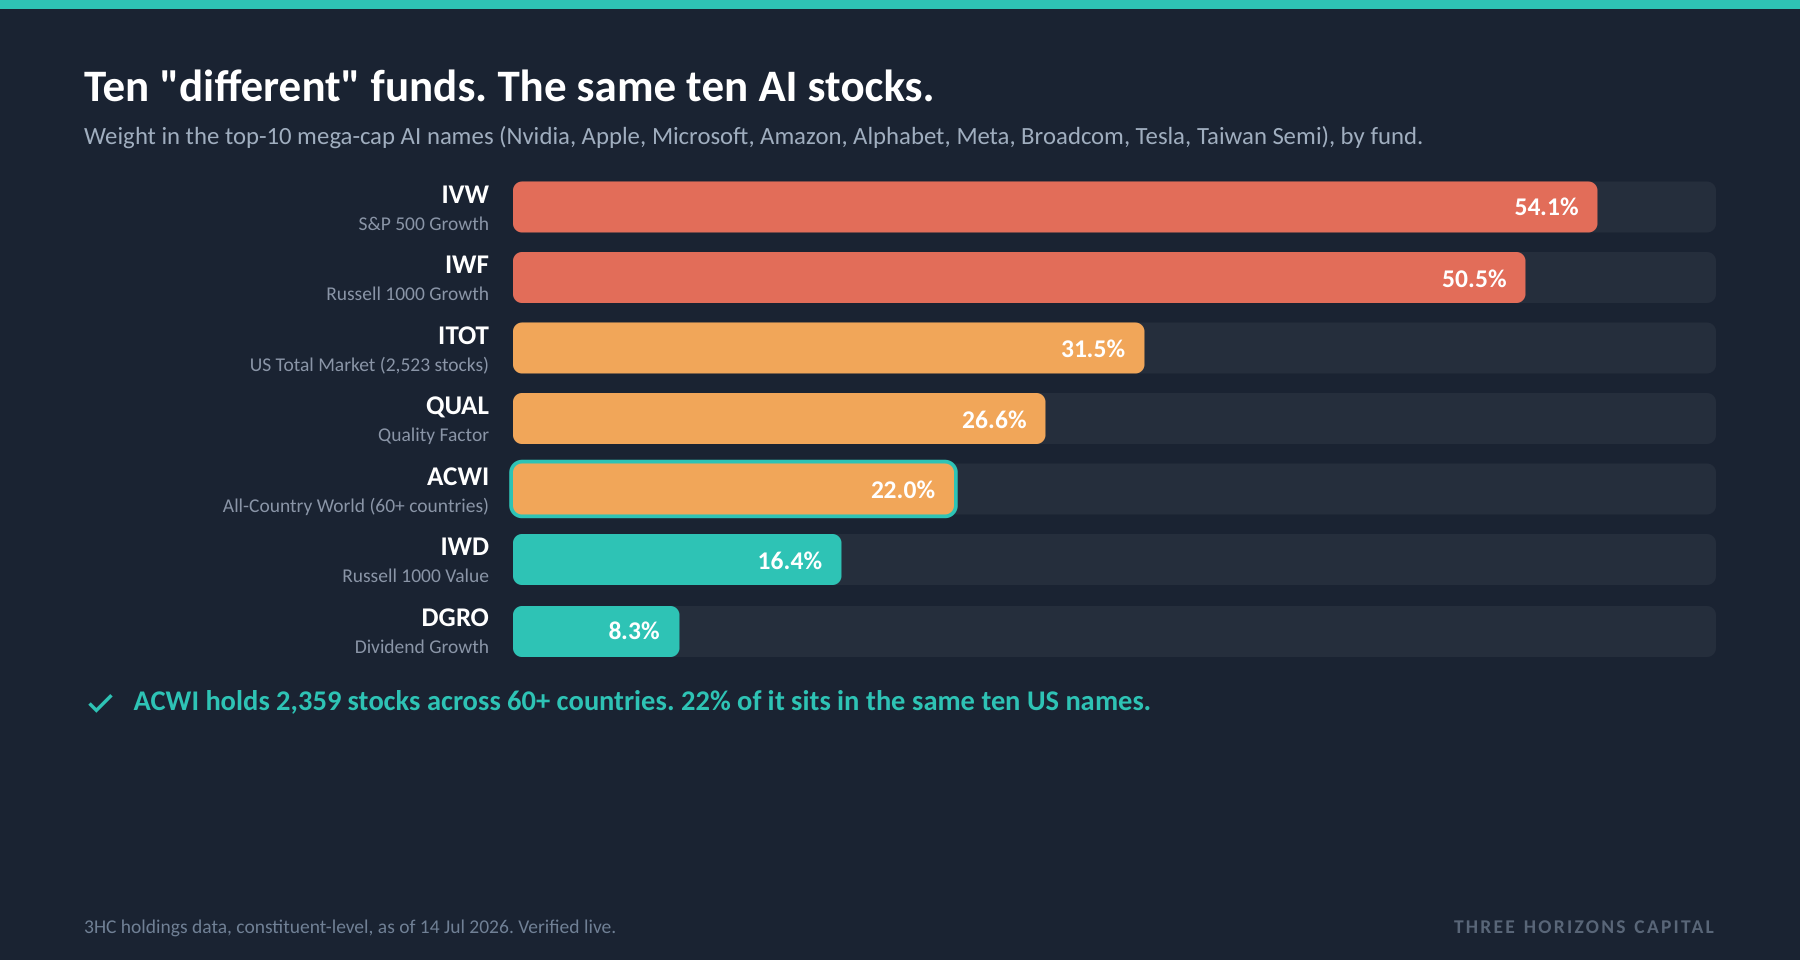
Ten "different" funds, the same ten AI stocks.
Unpack the holdings and multi-fund diversification collapses. A US growth ETF holds 54% in ten mega-cap names; a total-market fund of 2,500 stocks holds 31%; and an all-country world fund of more than 2,000 securities across 60+ countries holds over a fifth in the same ten US names. A client holding a US fund, a global fund and a growth fund has tripled down on one list of ten stocks. A European wealth manager holding the UCITS equivalents carries the identical overlap; it does not respect a border.
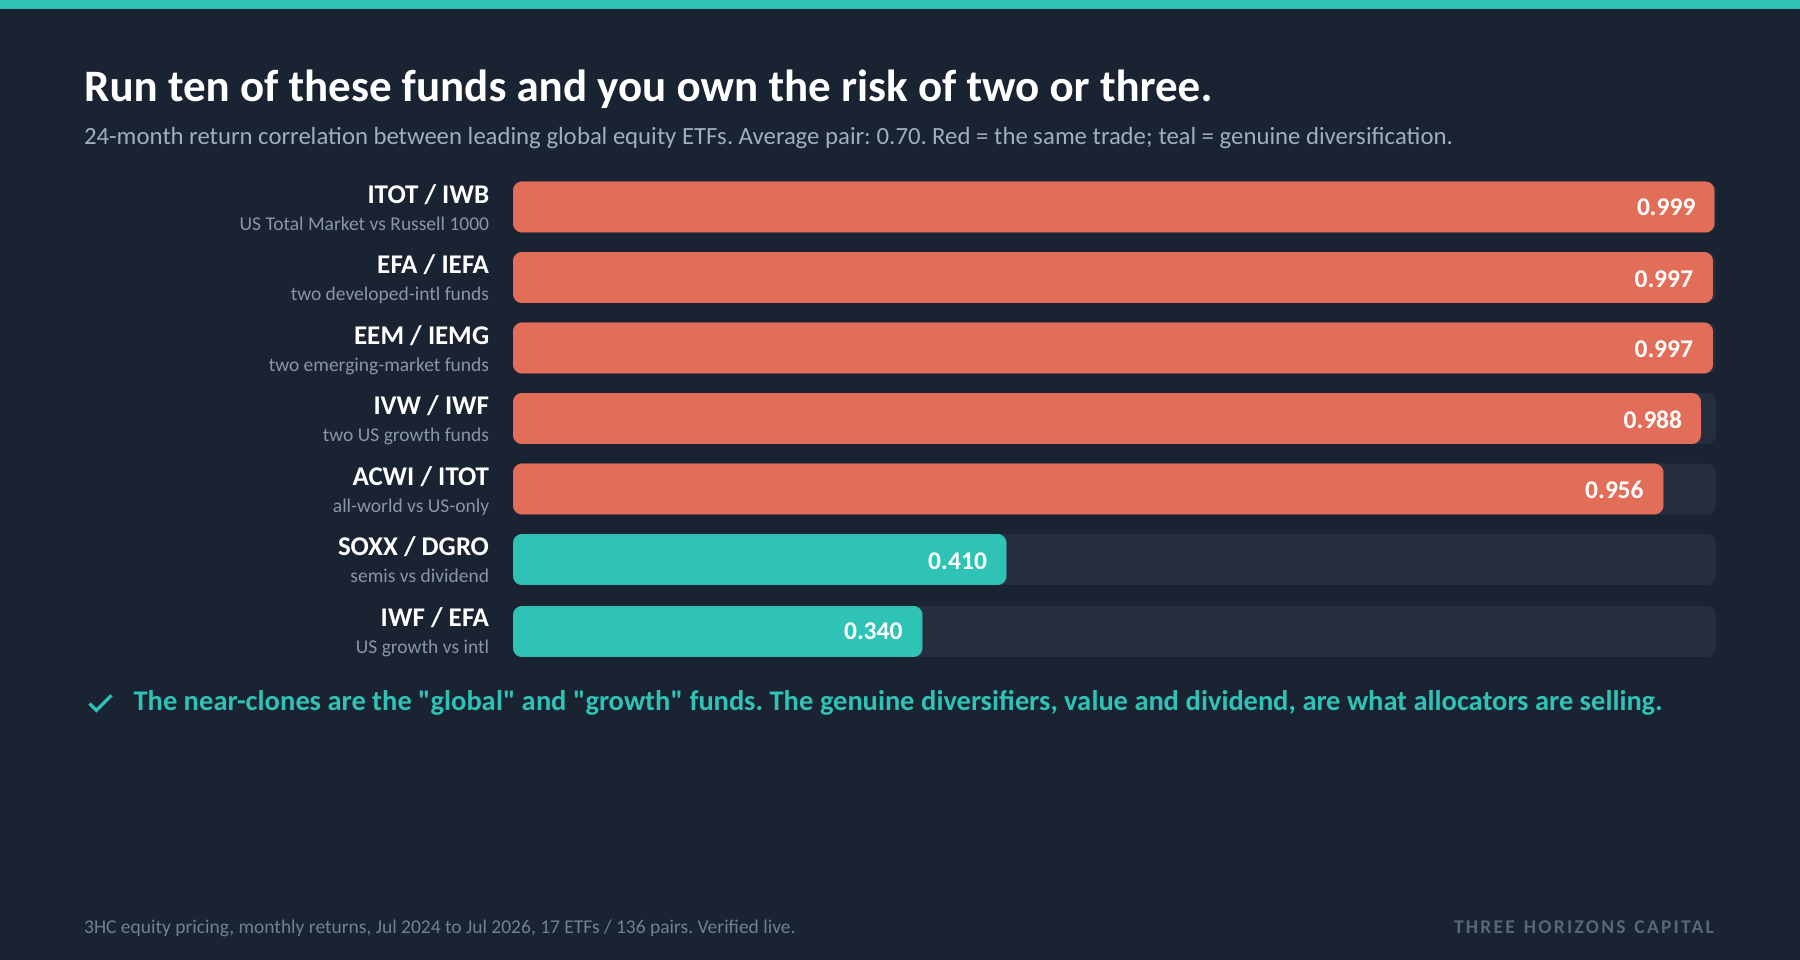
The return data confirms the clone structure. Across seventeen leading global equity ETFs over 24 months, the average pair correlates at 0.70; several pairs are statistically identical. Run ten of these funds and you own the risk of two or three.
We recently ran a holding-level attribution on a contrarian emerging-markets manager who did the opposite: a manager who deliberately stepped out of the crowded AI-and-technology complex, holding the dominant chipmaker directly but excluding the second-tier names and the consensus heavyweights. For a period into early 2026 the fund lagged its peers, and the attribution was unambiguous about why: it was the price of not owning the crowded trade. When a genuinely differentiated manager is penalised for stepping outside one cluster of stocks, that cluster is no longer a position in the market. It is the market.
What this tells you: The funds allocators reach for to feel diversified, the "global" and "growth" labels, are the near-clones. The genuinely different funds, value and dividend, are exactly what they have been selling. Diversification by fund count is not diversification by risk.
The safe half
The "safe" sleeve is priced for the same world.
Credit spreads sit near multi-year tights. Emerging-market debt pays about 40% less than its five-year norm, within about 15 basis points of its lowest spread in five years. The same conditions that support high AI multiples, abundant liquidity and low volatility, are the conditions that compressed those spreads. Meanwhile the default "core" bond allocation, which drew the largest fixed-income inflows of the year, carries close to six years of duration. A 75 basis-point move takes roughly 4% off that "conservative" holding, more than a year of its coupon.
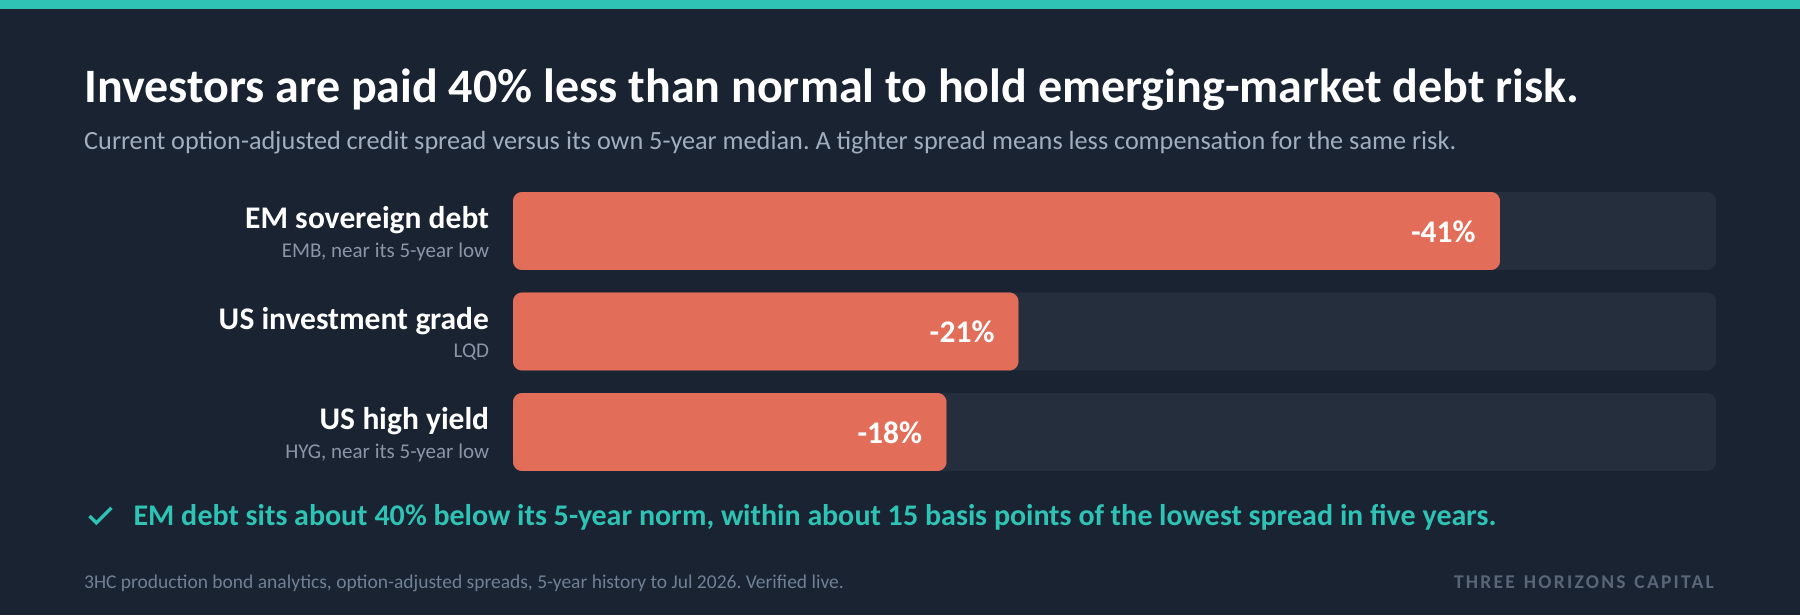
What this tells you: The point is not that bonds are secretly technology stocks; they are not. It is that the sleeve most investors hold precisely to behave differently is priced for the same conditions as the equity sleeve, and offers little cushion in the one scenario the portfolio is most exposed to: a repricing that hits crowded equities and compressed credit together.
No hedge, no buffer
There is nothing pointing the other way.
The asset classes that historically absorb a liquidity or valuation shock are close to absent from the US books we can measure. At the median US RIA, energy is 0.55% of the equity book and materials 0.43%; nearly half of advisers run less than 2% combined across energy, materials and utilities. The cash position behaves as a transit account, not a reserve: every risk-off event draws a brief inflow that is redeployed within weeks.
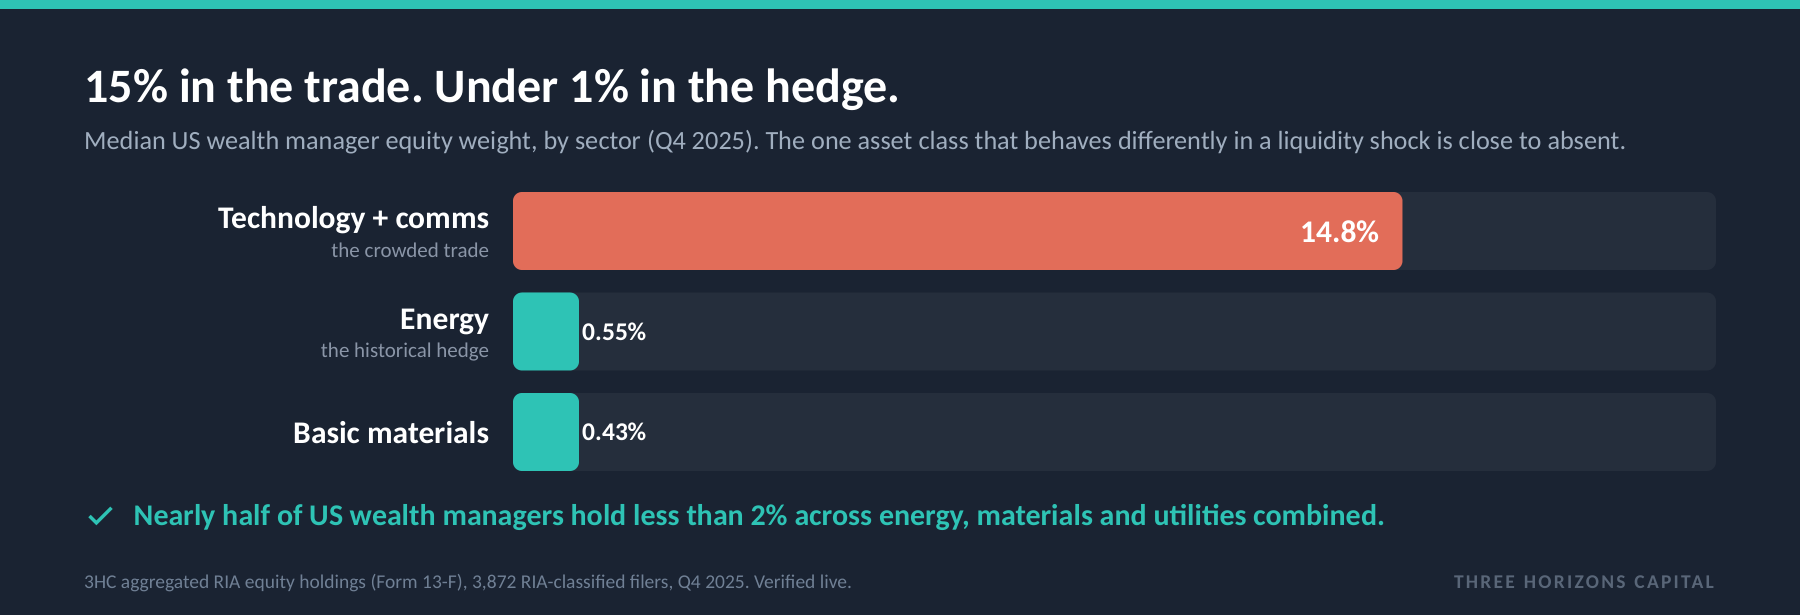
Stack the layers together and the picture is complete. The equity sleeve is concentrated in the AI complex. The diversification across funds is an illusion. The fixed-income sleeve is spread-compressed and duration-long. The hedge is absent and the buffer is spent. No layer provides structural insulation from the single thing it is most exposed to.
The odds
You do not need to forecast the correction.
The natural objection is that this only matters if AI actually de-rates, and nobody knows whether it will. That is exactly the point, and it cuts the other way. Consider the three things that can happen: multiples hold and the concentration compounds; multiples partially reprice in a volatile, drawn-out way; or the trade de-rates sharply. An investor does not need to assign probabilities to those paths, because the level of protection is the same in all three.
What this tells you: The protection does not improve because the benign case is the most likely one. Roughly 1% of the book sits in genuine hard-asset diversifiers and a few per cent in a cash reserve that is not really held in reserve. Whatever your view on AI, that is the floor you are holding, and most allocators, shown the holding-level number, find it is not one they would consciously choose.
What behaves differently
Rebuild the other side, while it is cheap.
The useful question is narrow: what has historically behaved differently when a crowded equity trade reprices? Four categories do, and the striking thing is that they are, almost exactly, the exposures allocators have been selling to fund more of the same trade. These are illustrative categories, not recommendations; the appropriate mix, if any, depends entirely on the individual portfolio.
- Genuine diversifiers within equities (deep value, dividend, true contrarian strategies)These sit at the low-correlation end of the data, not the 0.70 cluster. The manager who stepped outside the crowded names is the live example: a different return stream, available precisely because it does not own what everyone else owns.
- Real assets and energy (the structural void in Western books)The classic behave-differently exposure when a liquidity-rich regime reprices, and the one closest to absent from the portfolios we measured. The underweight is the opportunity.
- Managed-futures and trend strategies (DBMF; Man AHL, Winton, Millburn in UCITS form)A return stream that follows dislocations across rates, currencies and commodities rather than depending on the equity trade continuing, with a long record of positive performance in exactly the drawdowns that hurt crowded books.
- Short-duration cash held as a reserve (SGOV, SHV, BIL)Not the transit account, but dry powder deliberately kept: no spread or duration risk, and the ability to buy the repricing rather than be forced to sell into it.
The conclusion
You cannot manage what you have not measured.
Markets have concentrated into a single dominant theme before. Each time, the same reasoning held: the leaders were genuinely the best businesses, the valuations were justified by the technology, and to be underweight was to be wrong. Each time, the concentration was real right up until the point it reversed. This is not a prediction that AI repeats that pattern; it is a refusal to depend on it not doing so. When a crowded trade reprices, the labels stop mattering: "global equity," "strategic income" and "core bond" describe wrappers, not risk. The response is not a forecast but the opposite: measure your own floor, then rebuild genuine diversification, exposures that are actually uncorrelated, ballast that behaves differently under stress, and a reserve that is actually held. The place to start is a holding-level audit, before the market runs the test for you.
Sources: Three Horizons Capital equity holdings and pricing analytics (constituent-level as of 14 Jul 2026; monthly return correlations Jul 2024 to Jul 2026, 17 ETFs, 136 pairs); 3HC aggregated RIA equity holdings from SEC Form 13-F filings, 3,872 RIA-classified filers, Q4 2025; 3HC deduped, FX-converted fund-flow analytics, US and European domiciles, Jul 2025 to Jun 2026; 3HC production bond analytics, option-adjusted spreads, five-year history to Jul 2026. Sector weights classify ETF positions by the fund's primary Morningstar category; holdings not classifiable to a GICS sector are excluded from the sector denominator. The RIA cohort is every 13-F filer classified as a registered investment adviser for Q4 2025; an earlier 2,970-firm cohort used a narrower AUM threshold, so figures built on it are not directly comparable. The 0.70 average pairwise correlation is computed on a fixed basket of 17 global, total-market, growth and dividend equity ETFs (136 unique pairs) on monthly total returns, Jul 2024 to Jul 2026; a differently constituted basket will produce a different average. The contrarian emerging-markets manager referenced is an anonymised example from a 3HC holding-level attribution; no fund, share class or return figure is disclosed. All load-bearing figures independently verified against live proprietary data. European exposure is inferred from fund-flow direction. For research and platform-demonstration purposes; not investment advice. Securities and funds named are examples, not recommendations.