The proposition that started this
Every number in it was true. None of them was usable.
An approach reached us earlier this year. A work of art, offered to a private client, in the range where these things become portfolio decisions rather than purchases. It was a serious proposition. The artist holds work in half a dozen national museum collections, and we checked. The auction results quoted in the pitch were real, and we verified every one of them independently against three separate databases. The dealer was a genuine, long-established gallery. The five-year performance record attached to the email was not fabricated.
That distinction turns out to matter far beyond one proposition, because the same problem sits inside the risk report of almost every family that owns art. We built a representative family office portfolio, consolidated an art sleeve into it at the kind of valuation a family actually holds on file, and measured the result. The measured risk of the household went down.
The observation problem
Art sells when it has gone up, and every number you have follows from that.
Most art is sold privately, through dealers who do not register prices in any common database. Auction records are effectively the only data available, and they are not a sample of the art market. They are a sample of the art that came back to market. A work returns to auction when its owner believes it is worth selling. Works that have appreciated come back. Works that have not stay on the wall, move privately, or never trade again.
This is not our inference. It is the explicit caveat of the foundational study in the field. Mei and Moses, whose 1875 to 2000 repeat-sales dataset remains the reference work, write that the decision to sell, and therefore the occurrence of a repeat sale in the sample, may be conditional on whether the value has increased, and that this biases the estimated return upward. Their conclusion is that the mean annual return derived from repeat-sales data should be regarded as an upper bound on what investors actually earned.
What this tells you: Every return figure you will ever be shown for art, academic or commercial, is biased in the same direction, and the bias is upward. That is the starting position, before anyone has tried to sell you anything.
The measurement gap
The reported volatility is roughly half the real one, and two independent methods agree.
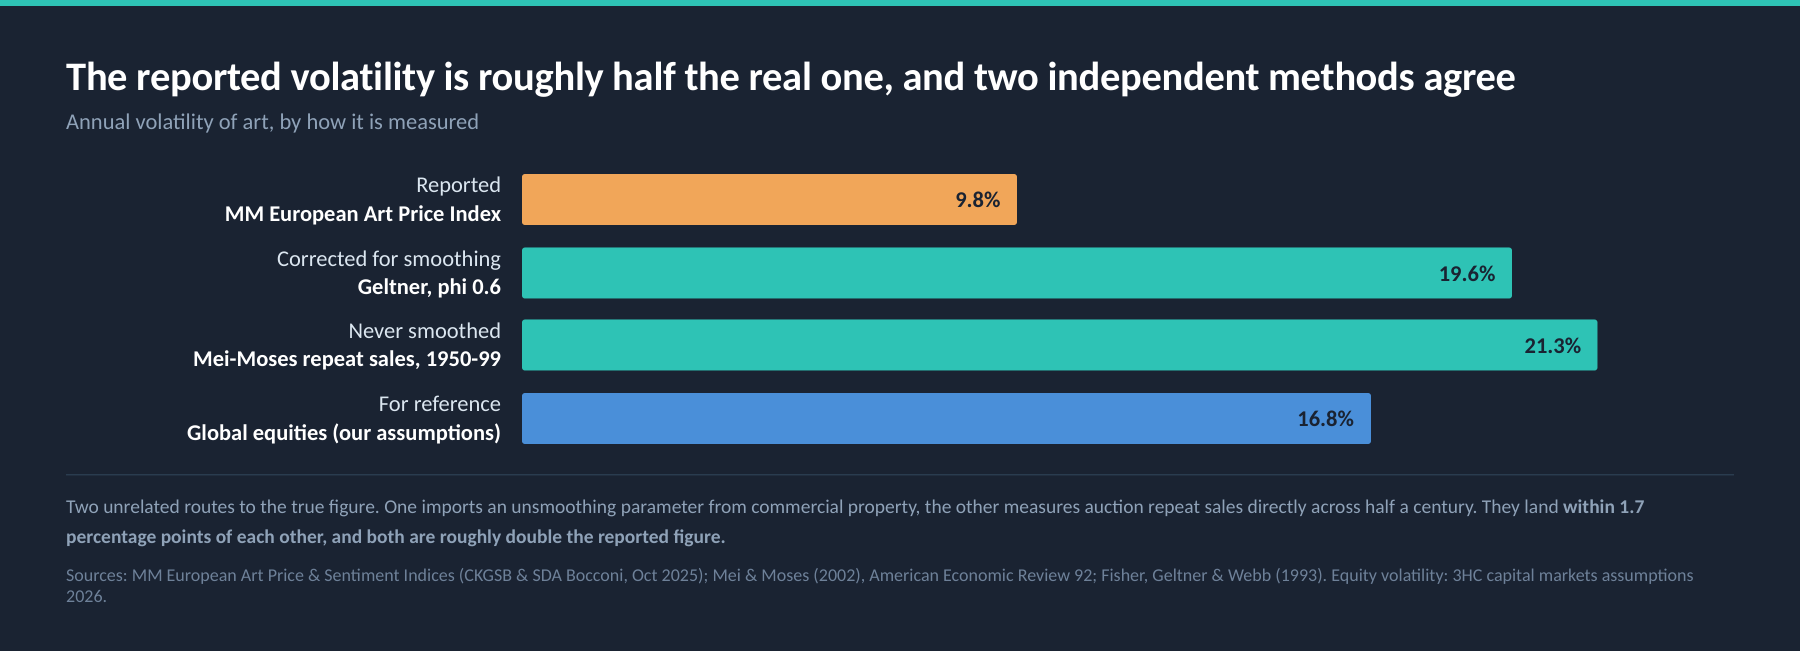
The MM European Art Price Index records an annualised return of 2.3% over 2000 to 2025 with a return standard deviation of 9.8%. On that number art is the least volatile asset in its own comparison table, against 20.4% for Euro large cap. That 9.8% is what reaches a family office risk report, directly or through a dealer mark that behaves the same way. It is too low, for a reason that has nothing to do with art.
Route one, correct the smoothing. An appraisal-based or dealer-set mark is anchored on the previous mark, which suppresses both measured volatility and measured correlation. The finance literature has corrected for this in commercial property since Fisher, Geltner and Webb published the procedure in 1993. At a phi of 0.6, the conservative end of the range that literature finds, 9.8% becomes 19.6%.
Route two, use a series that was never smoothed. Mei and Moses measured volatility directly from auction repeat sales, with no appraisal in the chain. For 1950 to 1999 they report 21.3%.
What this tells you: Two unrelated methods. One imports a parameter from commercial property, the other measures auction prices directly across half a century. They land within 1.7 percentage points of each other, and both are roughly double the figure that gets reported.
What the error costs
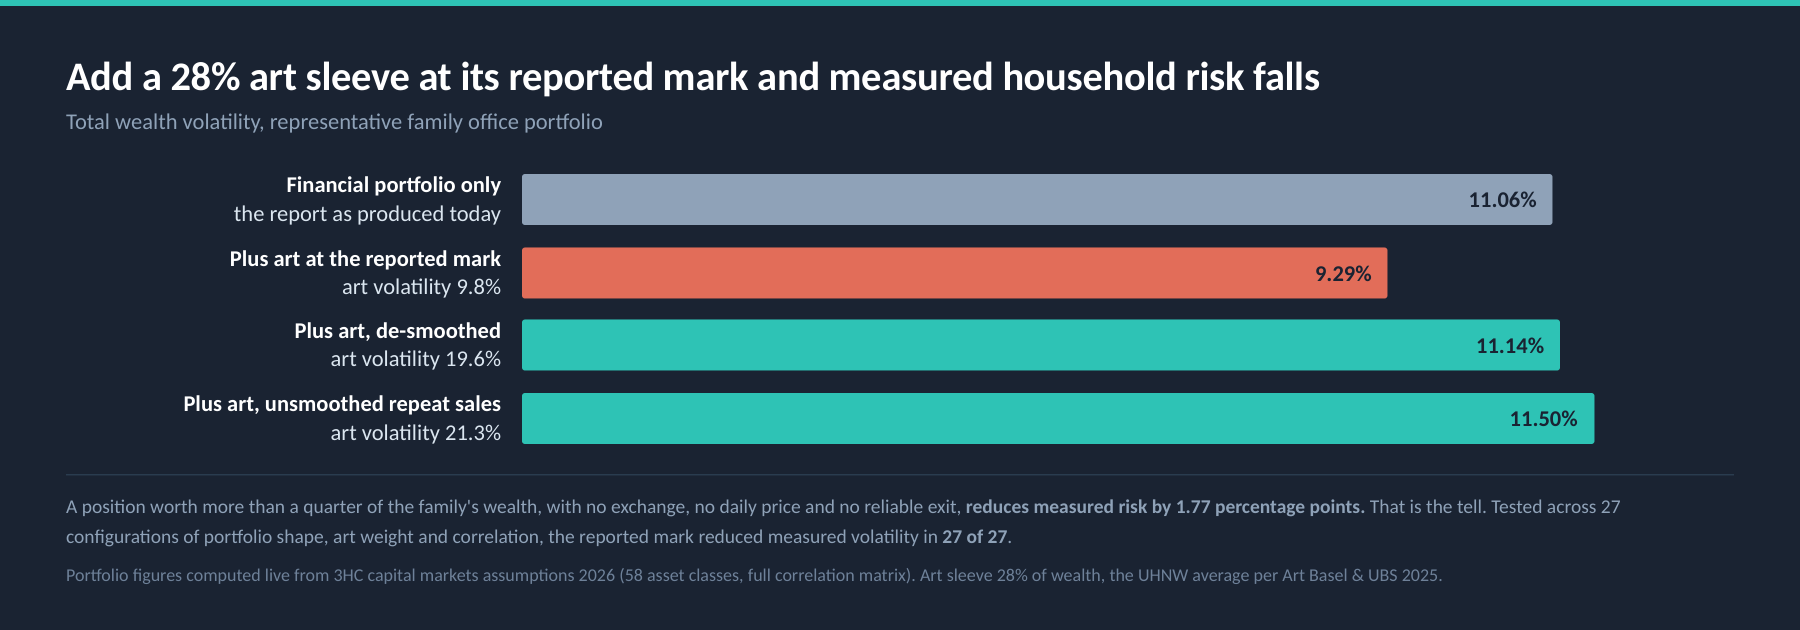
Adding a 28% art sleeve at its reported mark made measured household risk fall.
A representative eleven-sleeve family office portfolio, on our own capital markets assumptions, carries an expected return of 6.95% and a volatility of 11.06%. Consolidating an art sleeve at 28% of total wealth, the average share held by individuals above fifty million dollars of assets, produces the following.
| Treatment | Art vol | Total wealth vol | Art share of risk |
|---|---|---|---|
| As reported | 9.8% | 9.29% | 17.6% |
| De-smoothed, phi 0.5 | 17.0% | 10.61% | 31.9% |
| De-smoothed, phi 0.6 | 19.6% | 11.14% | 36.6% |
| De-smoothed, phi 0.7 | 23.3% | 11.94% | 42.7% |
| Unsmoothed repeat sales | 21.3% | 11.50% | 39.5% |
The family adds a position worth more than a quarter of its wealth, in an asset with no exchange, no daily price and no reliable exit, and measured household risk falls by 1.77 percentage points. We tested that across twenty-seven configurations of portfolio shape, art weight and correlation. The reported mark reduced measured volatility in twenty-seven of twenty-seven. We could not construct a case where it did not.
Allocation
Correct the volatility and the model’s appetite for art falls to nothing.
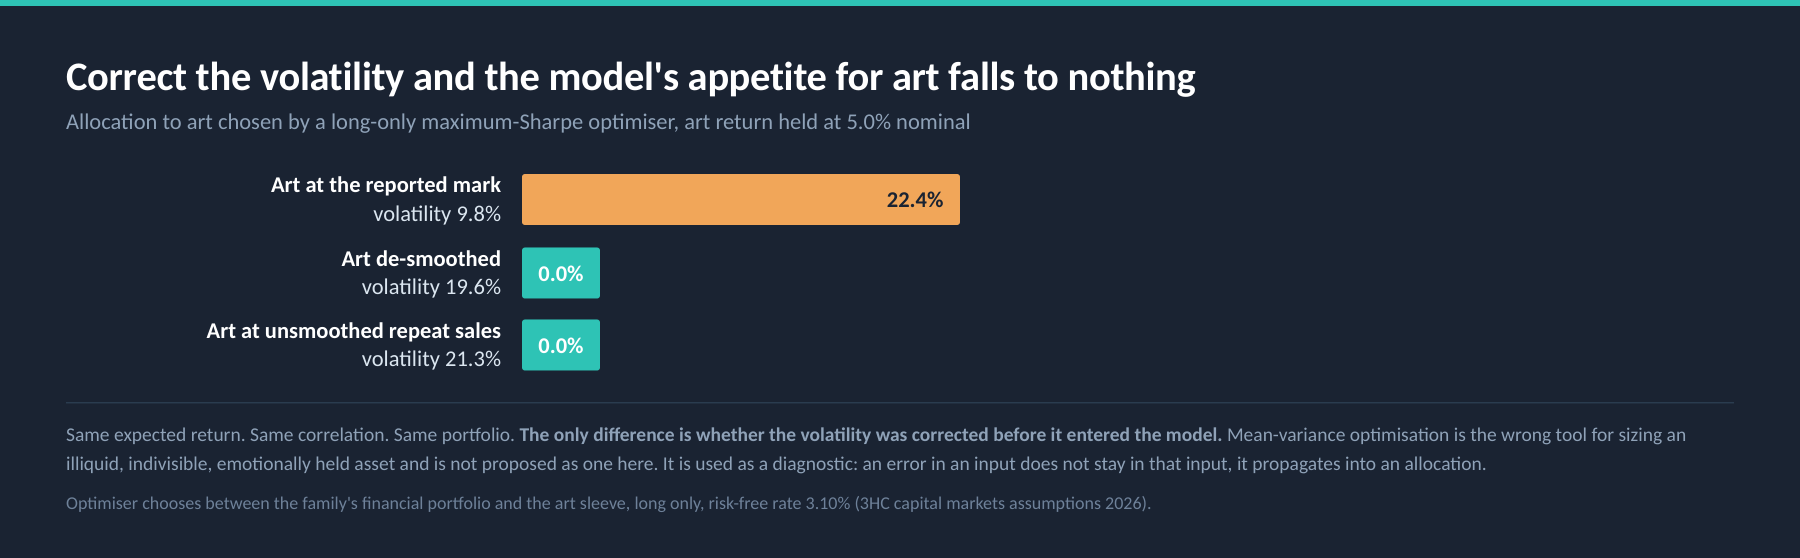
A long-only maximum-Sharpe optimiser, choosing between the family’s financial portfolio and its art, wants 22.4% of household wealth in art on the reported input and nothing at all on the corrected one. Same expected return, same correlation, same portfolio.
The same reversal shows in the risk-adjusted return of the sleeve on its own, against a 3.10% risk-free rate and a 7.7% nominal art return. As reported, art shows a Sharpe ratio of 0.469. Corrected for smoothing it is 0.235, and on the unsmoothed series 0.216. Global equities, on our own assumptions, sit at 0.238 with a volatility of 16.8%.
What this tells you: On the reported number, art looks roughly twice as good as owning the world’s stock markets. Corrected, it is indistinguishable from them. And unlike global equities it cannot be sold on Tuesday, costs money to store and insure, and carries the risk of physical loss.
A note on method, because the objection is fair. Mean-variance optimisation is the wrong tool for sizing an illiquid, indivisible, emotionally held asset, and we are not proposing it as one. It is used here as a diagnostic: an error in an input does not stay in that input, it propagates into an allocation recommendation. Any allocation process fed a smoothed number leans the same way, whether it is an optimiser, a risk budget, or a committee’s judgement.
The prescription
The input set we would actually use.
| Input | As published | Recommended |
|---|---|---|
| Volatility | 9.8% | 19.6% |
| Correlation to equities | 0.35 | 0.44 |
| Expected return, nominal | up to 8% quoted | 4% |
Correlation matters more than it looks, because correlation is the channel through which art claims to be a diversifier. Understating it is what makes the position appear to reduce household risk. On the return, four percent is generous rather than conservative: Europe dominates the underlying sample, at 5,578 of the 7,914 artists covered, and returned 2.3%. The most recent ten-year annualised readings are negative, at minus 0.9% in 2023 and minus 1.4% in 2024, the weakest since 1954.
Capacity
Express the limit as a share of the risk budget, not a share of wealth.
| If art may consume this share of portfolio risk | Cap the sleeve at this share of wealth |
|---|---|
| 10% | 9.7% |
| 15% | 13.5% |
| 20% | 17.0% |
| 25% | 20.2% |
| 33% | 25.3% |
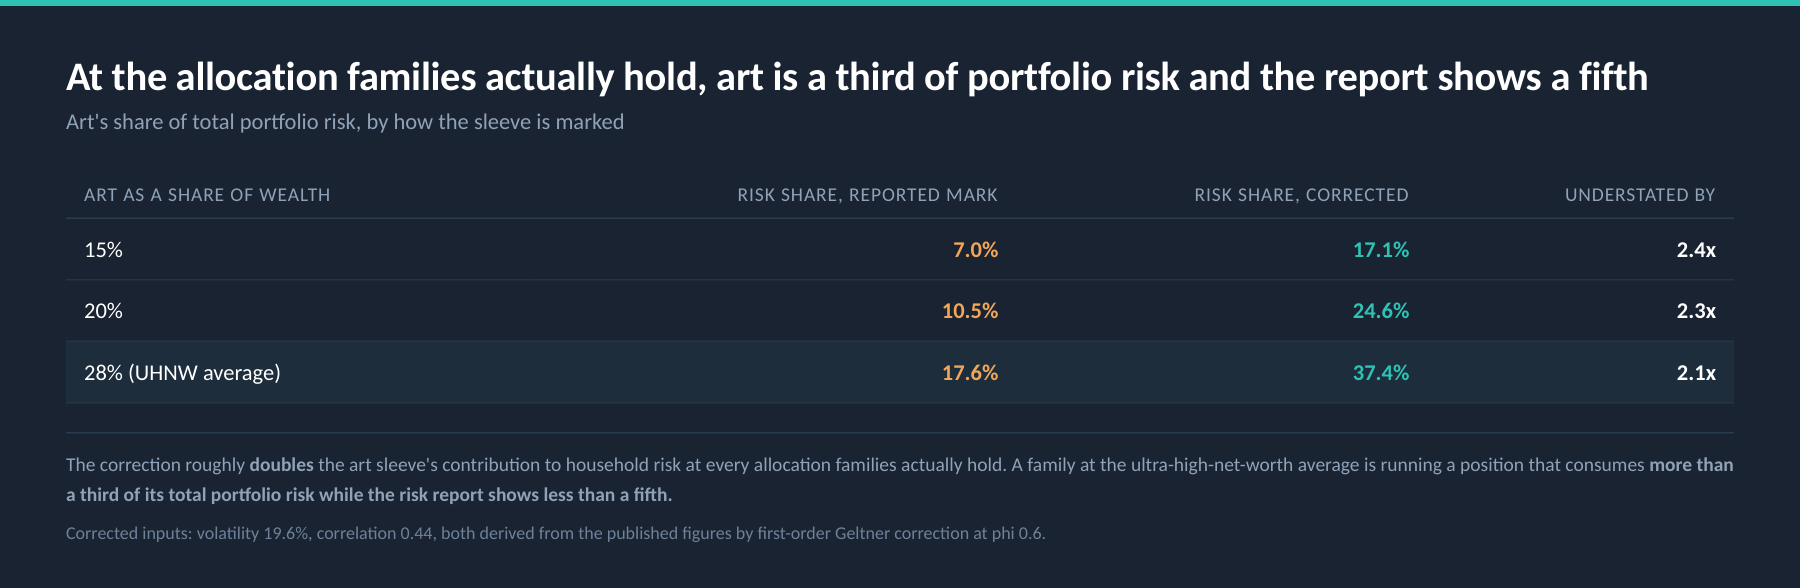
What this tells you: A family at the ultra-high-net-worth average is running a position that consumes 37.4% of its total portfolio risk on corrected inputs, while the risk report shows 17.6%. More than a third, reported as less than a fifth.
Concentration
The same $6 million is either prudently sized or nearly three times too large.
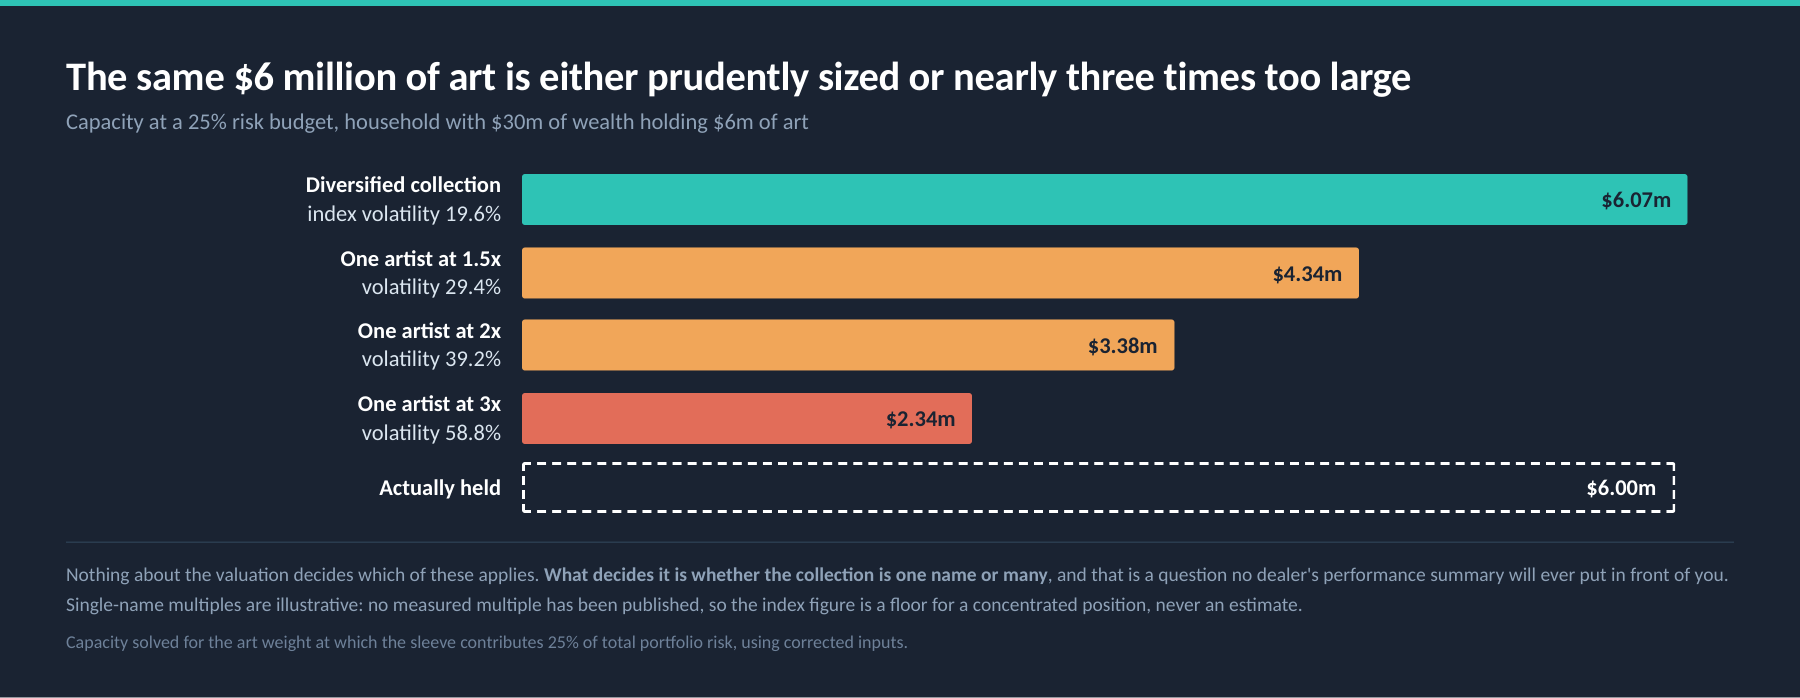
Every published art index is a diversified basket. The MM European index alone rests on 19,258 repeat sales across 3,821 artists. A single-artist position carries idiosyncratic variance that a basket of that size has diversified away, so the index volatility is a floor for a concentrated position and never an estimate of it.
What this tells you: Nothing about the valuation decides which case applies. What decides it is whether the collection is one name or many, and that is a question no dealer’s performance summary will ever put in front of you.
A diversified collection is governed by the risk budget. A single name with no independent secondary market is governed by survivability, which binds far tighter: the question is not what share of the risk budget it consumes but what share of the family’s wealth can be written off without changing anything that matters.
One question worth asking early, because it is almost never volunteered: of everything you have sold through this programme, what share has been bought back? A buyback record without a denominator is a list of the trades that worked.
Exclusion
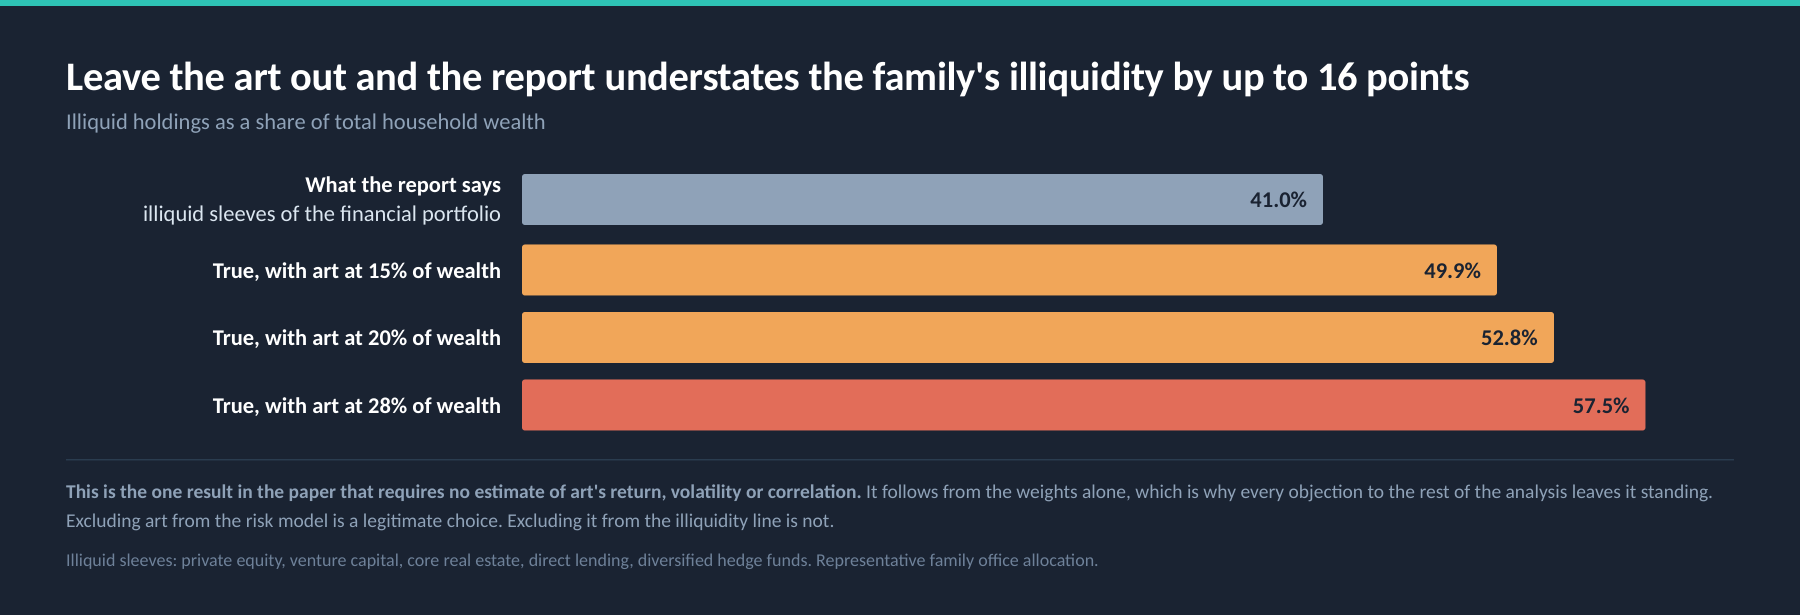
Leaving the art out does not solve it.
| Art share of wealth | Reported illiquid | True illiquid | Understated |
|---|---|---|---|
| 15% | 41.0% | 49.9% | +8.9 pts |
| 20% | 41.0% | 52.8% | +11.8 pts |
| 28% | 41.0% | 57.5% | +16.5 pts |
This requires no estimate of art’s return, volatility or correlation. It follows from the weights alone, which is why every objection to the rest of this analysis leaves it standing. Exclusion is a legitimate choice, on one condition: if the art is excluded from the risk model, it must also be excluded from any claim about diversification, and the family’s true illiquidity stated somewhere in the pack. What is not defensible is exclusion by default, because nobody had a number.
Why it matters commercially
The part of a client’s wealth you do not report on is the part where you are not the adviser.
If art is a fifth to a quarter of a client’s wealth and it does not appear in your reporting, a meaningful share of the balance sheet you are supposed to be advising on is somewhere you are not. Someone else is having that conversation: a dealer, an auction specialist, a private-client lawyer at the point of succession. Each of them is advising on an asset you have no number for.
The firms that keep those relationships through the next transfer of wealth will be the ones that can put the whole balance sheet on one page and defend every number on it, including the difficult one. That does not require becoming an art expert. It requires being willing to say what the art is worth in risk terms, on what basis, and with what uncertainty.