The first question an allocator faces on China is structural, not thematic. Two distinct investable universes exist, they are not interchangeable, and in 2026 they have diverged materially. Mainland A-shares trade in renminbi via Stock Connect quota and are dominated by domestic technology, semiconductors and industrials. Offshore H-shares and ADRs trade in Hong Kong and New York and are dominated by the consumer-platform names. The choice between them is the decision that matters.
Which market are you in?
One country. Two markets. A 15-point gap.
Between 3 April and 7 July 2026, mainland CSI 300 vehicles returned +9.0% while offshore MSCI China returned −6.2%. That is a 15.2-point gap in 13 weeks, and it runs entirely on the mainland/offshore axis, not on sector selection within either universe. The winning sectors of 2026 are mainland-heavy: domestic technology is about 31% of the CSI 300. The losing sectors are offshore-heavy: consumer cyclical and communication services, Alibaba, Tencent, Meituan and Baidu, are about 39% of MSCI China.
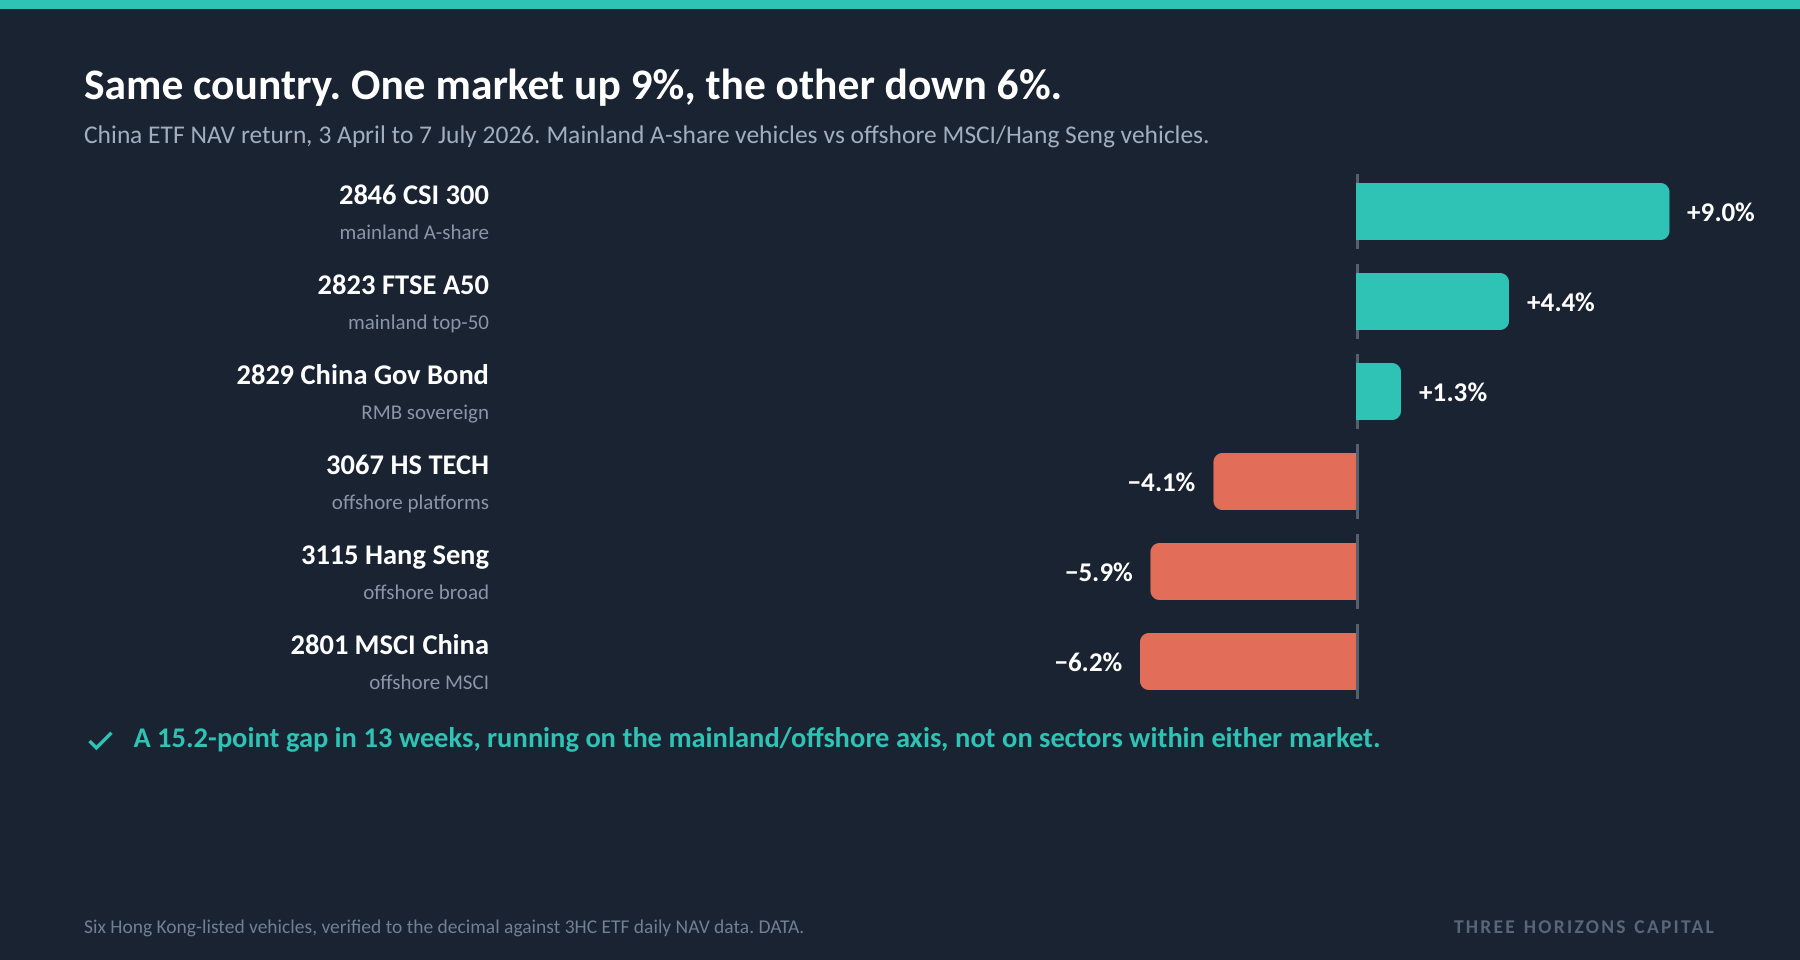
What this tells you: When commentary says "Chinese technology is outperforming," it means domestic semiconductors and industrial hardware inside mainland A-shares, not the US-cross-listed platform names that dominate offshore indices. An allocator buying MSCI China for tech is buying platform names, the opposite trade. Our factor model shows Chinese domestic equity has a Growth-factor correlation of only 0.48 and just 24% R² against the three global structural factors, so China is its own idiosyncratic bet, not an EM proxy.
Where the capital sits
Europe built the overweight, then cooled.
Most allocators are not buying China directly; they hold it inside emerging markets. On our reconciled net-flow series, European institutions added roughly $70 billion of EM equity in 2024, the largest single-year allocation on the series and about five times the US that year. Since late 2024 that flow has cooled into mild net outflow. This is a dollar-diversification trade that carries implicit China exposure as a constituent, roughly 25 to 30% of broad EM, not a targeted China timing call. It tells you where capital is sitting, not when to follow it.
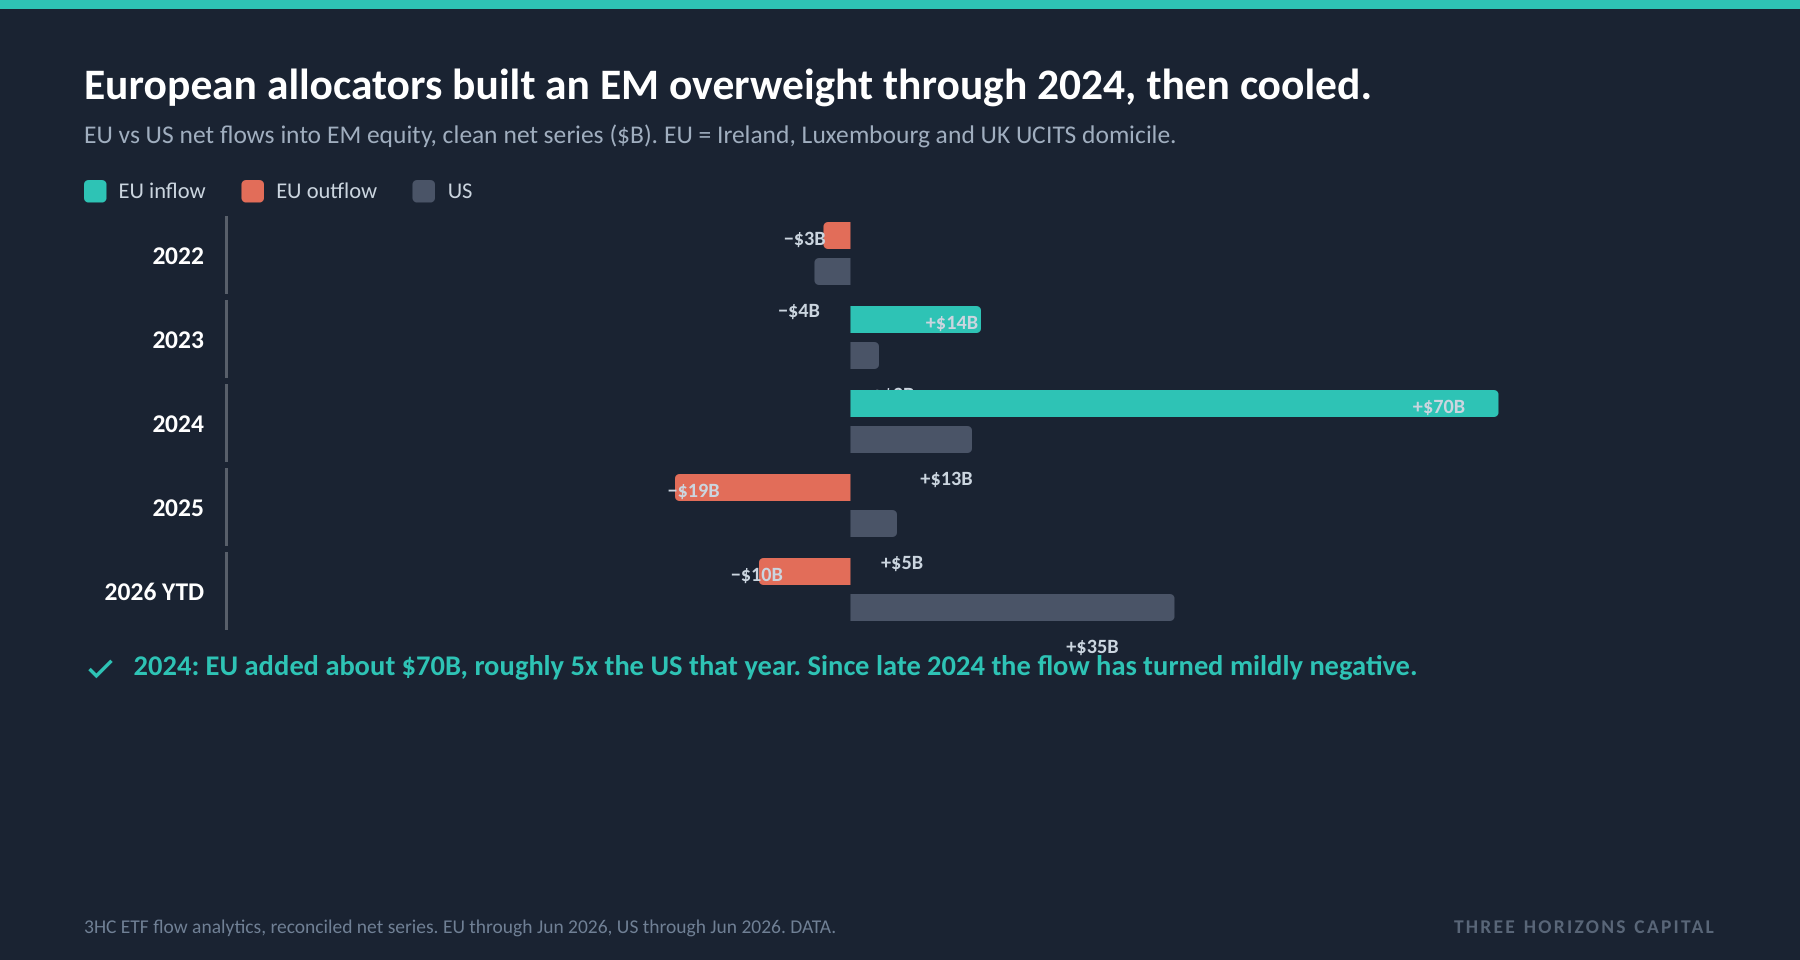
What this tells you: When Europe buys China specifically, the signal points the other way. EU flows directed into China-equity UCITS categories are a statistically significant contrarian indicator: r = −0.45 (p = 0.001, N = 51). The five largest EU inflow months into China each preceded a negative three-month return. The current mild EU China outflow is, by that signal, mildly constructive for a contrarian entry, not a warning to follow the herd.
The confirmation
The bond market agrees: EM spreads near a 15-year low.
The equity positioning is independently confirmed in credit. EM sovereign spreads have compressed from 389bps in 2022 to 181bps today, one of the most sustained tightening cycles in EM history. The April 2026 spike to about 211bps (the Strait of Hormuz shock) fully reversed within eight weeks, the signature of a strong, sticky institutional bid at roughly the 200bps level.
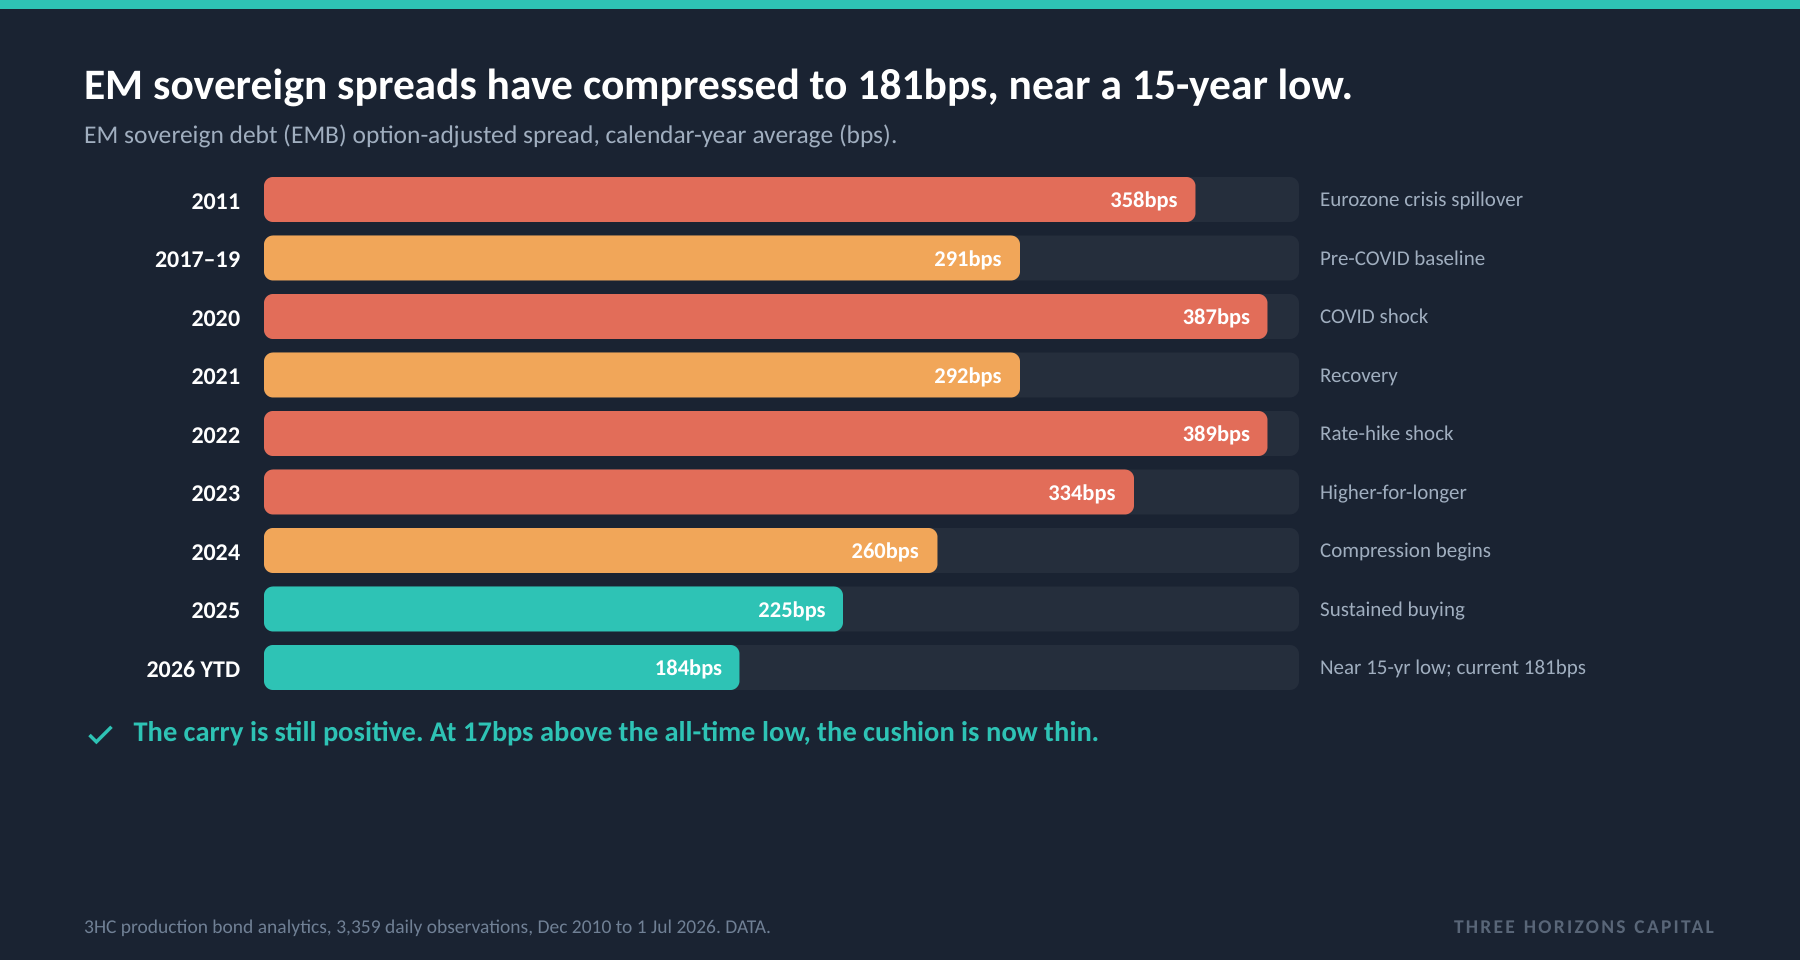
What this tells you: The carry is still positive at roughly 6.25% yield, materially more than US investment grade. But the cushion is thin: just 17bps above the all-time low of 163.9bps. A China hard landing, a tariff re-escalation, or a global risk-off event could widen spreads 50 to 80bps rapidly, as April showed, offsetting months of carry.
So which China?
A vehicle decision, made explicitly.
If you are a European institution already overweight EM, you already hold China; the question is whether your MSCI-based vehicle is giving you the offshore platform names when the return has been in mainland industrials, and whether an explicit mainland A-share sleeve is the right complement. If you are a US allocator with lighter EM, the structural EU overweight is worth interrogating, but targeted EU China buying has historically been a signal to fade, so the honest question is one of entry point against a thin credit cushion. For targeted thematic exposure, only the mainland vehicle (CNYA, 2846) expresses the domestic AI and industrial-tech theme; offshore thematic indices are platform names, not domestic hardware.
The one discipline that matters: any portfolio review that aggregates mainland and offshore China under a single "China allocation" line is obscuring its own risk.
Sources: Three Horizons Capital ETF daily price and NAV data through 7 July 2026 (mainland and offshore vehicle returns; the six Hong Kong-listed vehicles are verified to the decimal, US-listed vehicle returns are from public price feeds); ETF flow analytics, reconciled net series, EU by UCITS domicile and US, through June 2026, with structural/narrative flow decomposition; EU UCITS China flow correlation over 51 monthly observations, January 2022 to March 2026; production bond analytics (EM sovereign spreads, 3,359 daily observations, Dec 2010 to 1 Jul 2026; 181bps current, 163.9bps 15-year low, verified live); J.P. Morgan 2026 long-term capital market assumptions (USD); and a research-library synthesis of institutional research through 30 Jun 2026. For research and platform-demonstration purposes; not investment advice. Asset classes and vehicles are examples, not recommendations.