Portfolio construction
What Replaces Bonds?
From 1986 to 2020 core bonds cut portfolio risk by more than they cut return. Since 2021 they have not, and no single substitute does that job alone.
Three Horizons Capital, Portfolio Analytics. Headline figures on monthly returns, January 2021 to 31 December 2025. Broader screen and sizing ladder from the first research round, 2021 to 2025. Fund flows January 2021 to July 2026. US dollars.
+0.63
Correlation of core bonds to US equities on monthly returns, January 2021 to December 2025, and positive at every frequency tested
12.0% at 8.7%
Return and volatility of a 60/20/20 equity, gold and market-neutral book, against 8.2% at 10.9% for the 60/40
~65%
Organic growth of equity market-neutral funds since January 2021, the fastest of any category examined
The finding in one line
The job bonds used to do is best approximated today by a deliberately sized barbell of market-neutral and gold, not by a one-for-one swap, and capital is already moving the same way.
The 60/40 was built on one property, and that property stopped holding in 2021
The 60/40 portfolio rests on a single statistical property. When equities sell off, core bonds rally, or at least hold steady, so the blend buys a meaningful cut in risk for a small give-up in return.
That property held from 1986 to 2020. A chart published by the Financial Times, built on Aswath Damodaran's data at NYU Stern, traces a bowed curve over that period: moving from 100% bonds to a 50/50 mix added roughly 2.7 points of annual return while risk barely moved. That is the signature of a genuine hedge.
Since 2021 the curve has straightened into a near-diagonal, upward-sloping line. Every extra point of return now costs a roughly proportional point of risk, exactly as if bonds were just another risky asset.
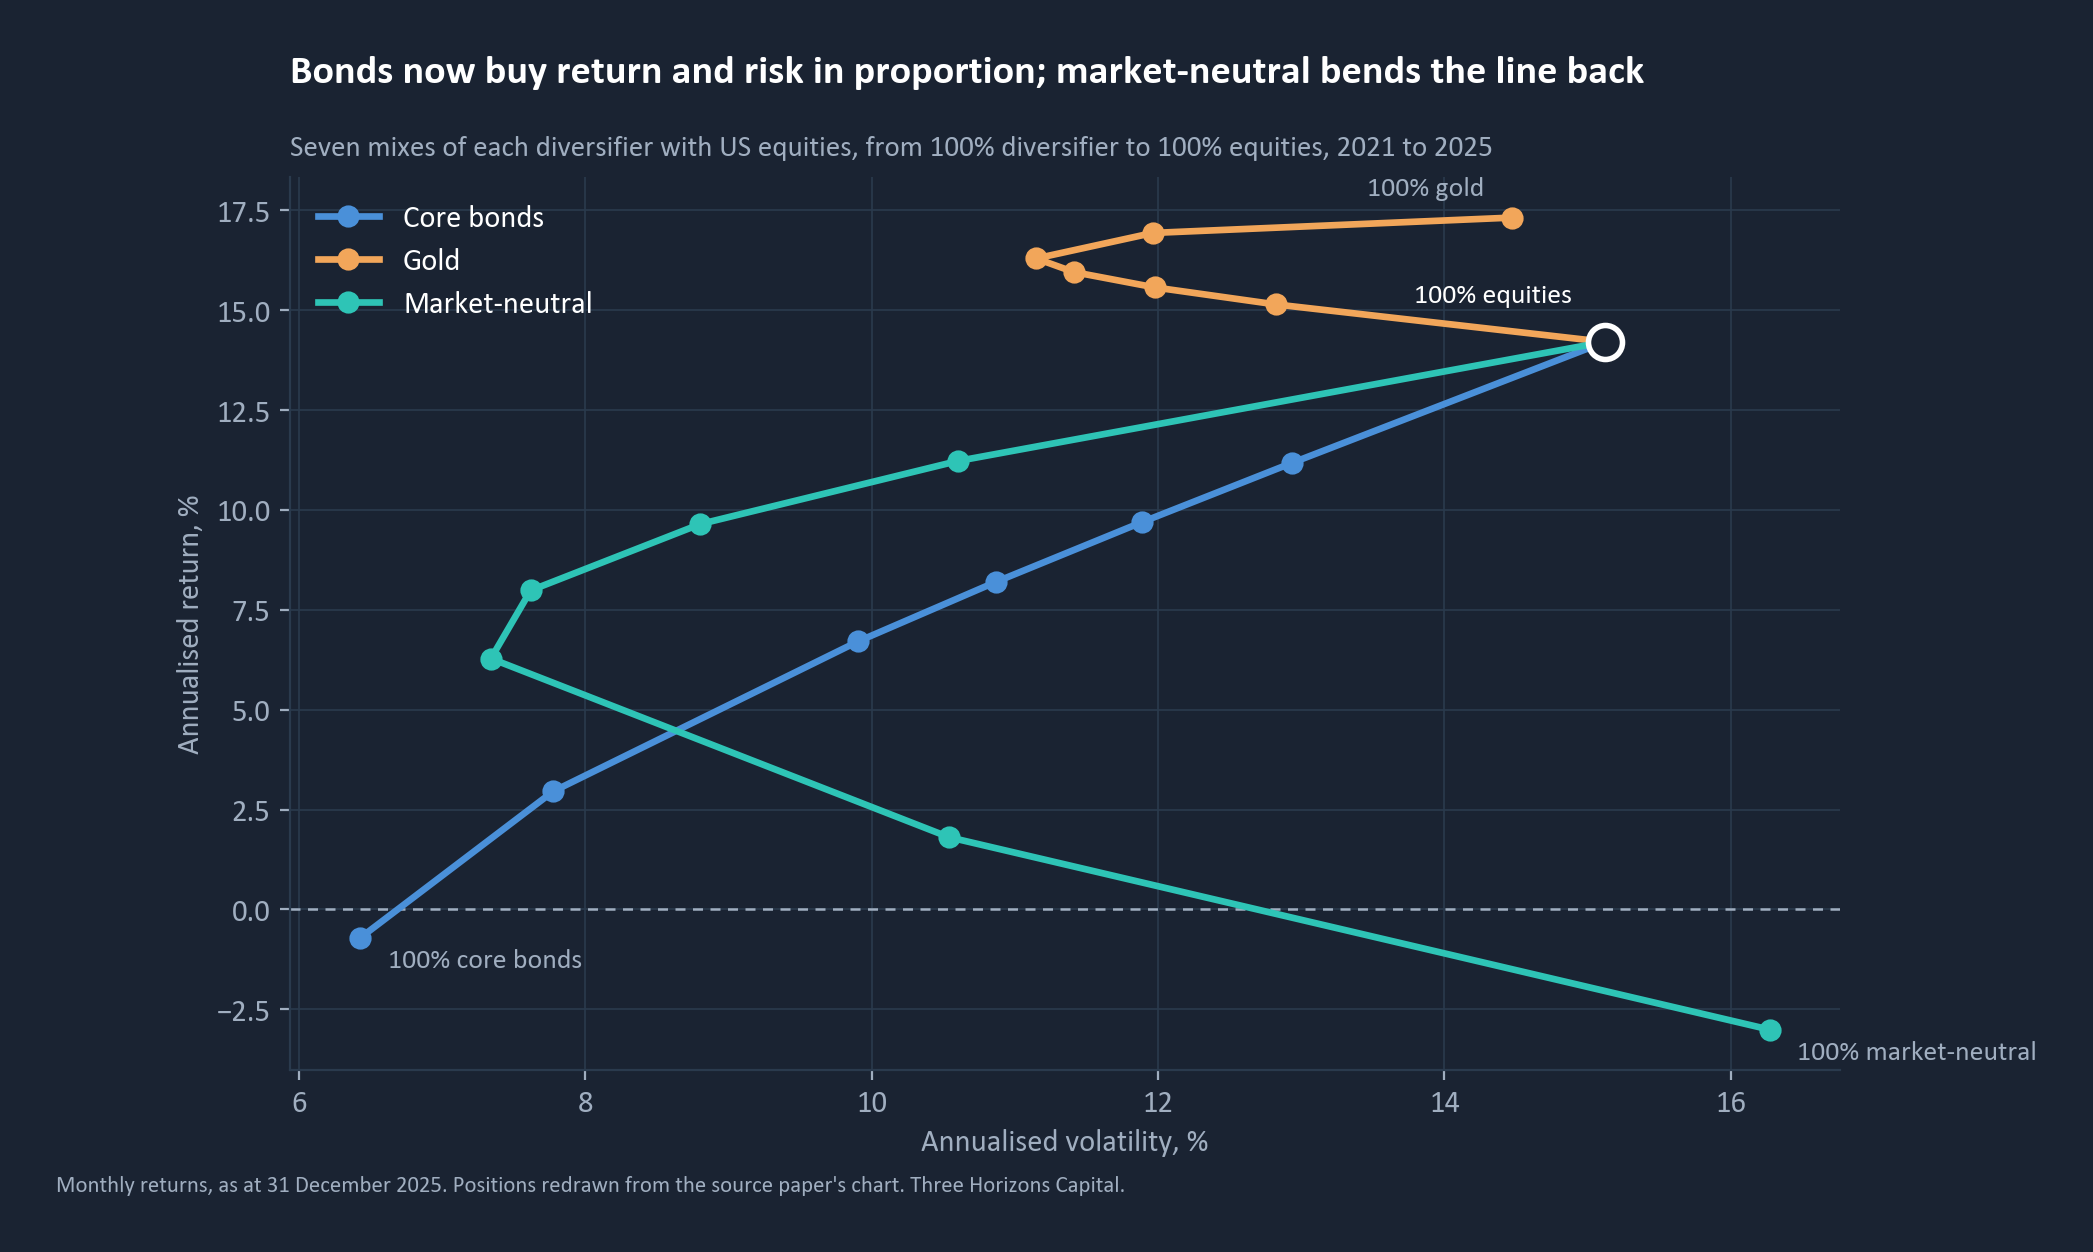
On monthly returns from January 2021 to December 2025, a 100% bond book returned -0.72% a year at 6.4% volatility. A 60/40 portfolio grew $100 to $148.30 over five years, against $194.40 for equities held alone.
This is not a failure of bonds. It is bonds behaving exactly as their duration dictates once the dominant macro shock is inflation rather than growth. When growth shocks dominate, as they did for most of 1986 to 2020, bad news cuts earnings and rates together: equities fall, bond prices rise, and the correlation is negative. When inflation shocks dominate, as they have since 2021 through the reopening, fiscal stimulus, the energy shock and the central-bank response, a rate hike hits equity valuations and bond duration at the same time. Both fall together, and the correlation turns positive.
The correlation has turned positive at every frequency tested, and it is still rising
Core bonds' correlation to US equities is +0.63 on the monthly rebuild used throughout this paper's headline tables, and an earlier independent monthly cross-check computed +0.627. It is +0.71 on a trailing eight-year annual basis and +0.77 on a five-year annual basis, so the more recent window is the more correlated one: co-movement is increasing, not mean-reverting. On the first round's full-period weekly series it is +0.26.
Every major duration and credit proxy shows the same pattern on a five-year and eight-year annual basis: long Treasuries 0.84 and 0.65, investment grade corporates 0.80 and 0.77, high yield 0.89 on five years, and intermediate Treasuries 0.61 on eight.
Inflation-linked Treasuries, the instrument built specifically to hedge inflation, carry the highest equity correlation in the duration group, at 0.89 on five years and 0.80 on eight. When the shock is inflation itself, the inflation hedge and the equity market are hit by the same lever, rate hikes, and they fall together.
The magnitude depends on the frequency, a known effect of aggregating returns over longer intervals, and it is most pronounced for core bonds at 0.26 weekly against 0.71 annual. The direction does not change. It is positive at every frequency tested.
2022 was not an isolated stress event, it was the regime revealing itself
In calendar 2022 core bonds returned -13.0% while US equities returned -18.2%. Bonds cushioned only about a third of the equity drawdown, far short of the offsetting or positive returns they delivered in the sell-offs of 2000-02, 2008 and 2020.
Across the full 2021 to 2025 period, the maximum drawdown in core bonds, -17.5% to -18.0% depending on frequency, sits far closer to the equity drawdown of -23.9% than the pre-2020 playbook would predict. By the end of 2025 bonds had still not recovered their starting value, at 96.4 against a base of 100, while equities nearly doubled to 194.4.
The return side confirms the risk side. A 60/40 book cut risk by 28%, at 10.9% volatility against 15.1% for equities alone, and paid for it with a 60% return cut. For a genuine hedge risk should fall by more than return, and here it fell by less.
On an eight-year view, core bonds are no longer statistically distinguishable from equities
Group thirteen assets by their eight-year annual return correlations and four clusters emerge. US equities, core bonds, long Treasuries, intermediate Treasuries, inflation-linked Treasuries, investment grade corporates, high yield, hedge fund replication and US real estate all fall into one cluster. Only gold, trend-following managed futures and broad commodities form clusters of their own.
The first research round's broader screen confirms this at a finer resolution. It grouped fourteen liquid, tradable candidates into six clusters by their average correlation to equities and to core bonds, with a clean, monotonic separation and no borderline cases.
| Cluster | Members | Avg. corr. to equities | Avg. corr. to core bonds |
|---|---|---|---|
| Credit-forward, equity-like fixed income | High yield; hedge fund replication | +0.88 | +0.86 |
| Equity-directional real assets | US real estate | +0.83 | +0.43 |
| Duration and rate-sensitive core, now equity-correlated | Core bonds; long, intermediate and inflation-linked Treasuries; investment grade corporates | +0.71 | +0.96 |
| Equity-directional alternatives, dampened beta rather than a hedge | Long/short equity; managed futures strategy | +0.61 | +0.45 |
| Commodity and inflation-beta diversifier | Gold; broad commodities | +0.22 | +0.11 |
| Negative-correlation crisis hedge | Market-neutral anti-beta; trend-following managed futures | −0.82 | −0.53 |
Cluster summary on a weekly and annual correlation basis, 2021 to 2025 screen. The sign holds across weekly, monthly and annual frequencies for core bonds, gold and market-neutral. The magnitude varies materially by frequency, a known aggregation effect rather than evidence of a uniform correlation level.
Two clusters matter most. The duration core, the group bonds themselves occupy, averages +0.71 to equities: the asset being replaced is itself equity-correlated. The negative-correlation crisis hedge is the only cluster of the fourteen candidates with negative correlation to both equities and core bonds. Every other cluster, gold's included, carries a positive correlation to equities, however low.
Two candidates sit in that hedging cluster, market-neutral and trend-following managed futures. Market-neutral was carried forward not on correlation alone but because its flow profile provides an independent demand signal that the managed futures category does not match over this period, set out in section 09.
Gold enhances return, and market-neutral is the only one of the two that hedges
The monthly scorecard sets the bond baseline against the two instruments carried forward from the screen, with equities for reference.
| Asset | Ann. return % | Ann. vol % | Corr. to equities | Max DD % | 2022 return % | Avg return, worst 20% of months % | Growth of $100 |
|---|---|---|---|---|---|---|---|
| Core bonds | -0.72 | 6.43 | 0.63 | -17.5 | -13.0 | -2.10 | 96.4 |
| Gold | 17.31 | 14.47 | 0.14 | -15.9 | -0.8 | -0.25 | 222.2 |
| Market-neutral | -3.00 | 16.27 | -0.56 | -29.7 | 20.5 | 3.29 | 85.9 |
| US equities | 14.21 | 15.12 | 1.00 | -23.9 | -18.2 | -5.49 | 194.4 |
Monthly returns, as at 31 December 2025.
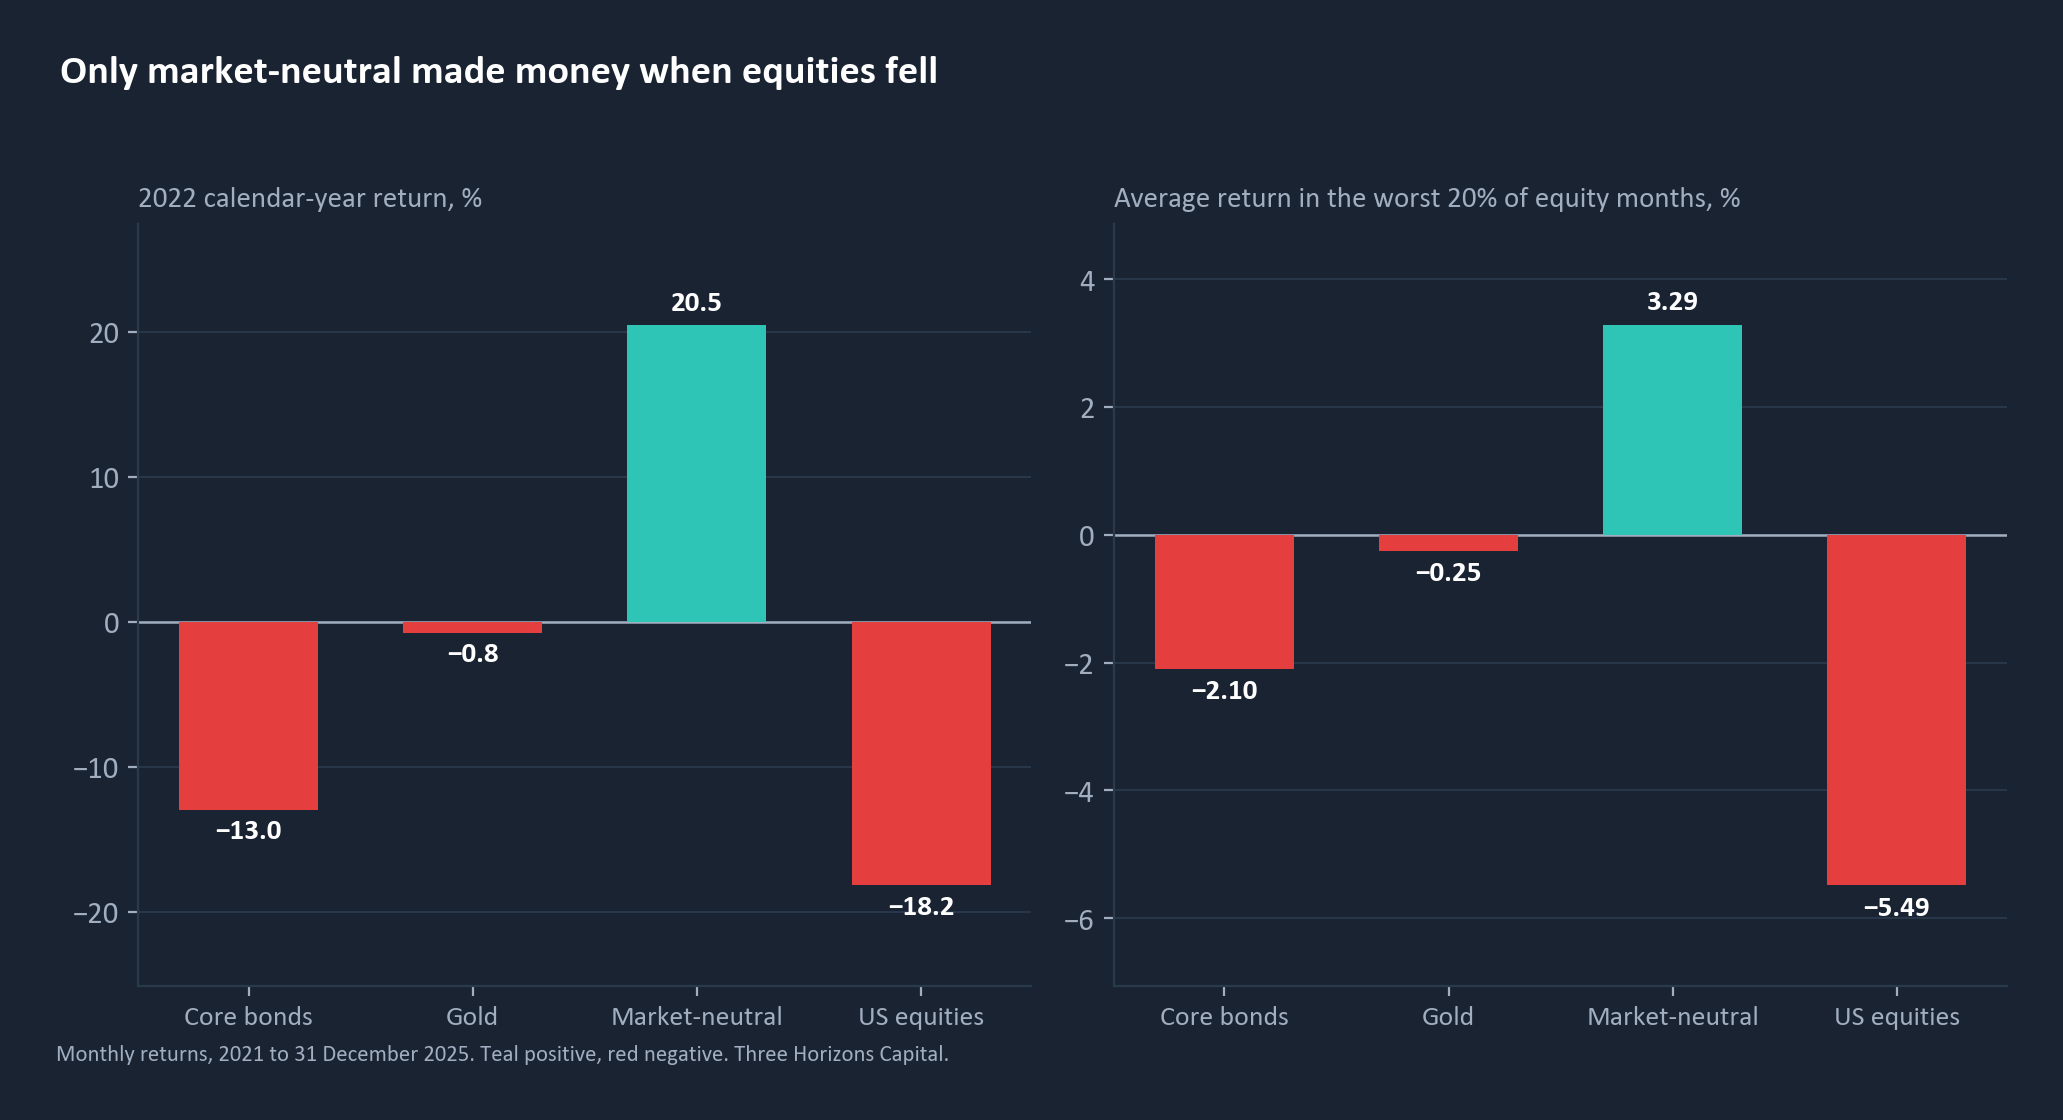
Gold produced the strongest headline return, on a low, positive correlation to equities: 0.14 monthly and 0.13 weekly. It was flat to negative when it mattered, -0.8% in 2022 and near-flat in the market's worst months. It is a return-enhancer, not a crisis hedge, and its edge is concentrated in one rally year.
Gold's 2025 return, reconciled
Gold's calendar-year 2025 return is approximately 63.7 to 64%, confirmed on both monthly and weekly recomputation. This reconciled figure replaces the earlier chart-pack estimate, and the conclusion that gold's demand was concentrated in 2025 rather than structural is unchanged.
Market-neutral is the only instrument of the two with genuinely defensive behaviour: negative correlation at every frequency, -0.56 monthly and -0.62 weekly, a positive average return in the worst 20% of equity months, and a 2022 result more than 30 points ahead of bonds, at +20.5% against -13.0%. It is also the most expensive sleeve in absolute carry terms.
The first round's weekly scorecard also covered long/short equity: 11.46% a year at 9.53% volatility, +0.88 correlation to equities, a -10.3% maximum drawdown, -5.6% in 2022 and $100 grown to $172.4. It improved the return and risk trade-off against bonds at every mix point tested, but it stayed highly equity-correlated. It is a dampened equity sleeve rather than a hedge, it is not covered by the monthly return feed used for the refresh, and it was never part of the recommendation in either round.
Blend the two and the sleeve holds a negative correlation to equities at every ratio tested
No single candidate combines gold's carry with market-neutral's hedge, so the practical construction is a blend, sized deliberately. The first round tested a full ratio ladder for the standalone market-neutral and gold sleeve, isolated from the rest of the portfolio.
| Blend (market-neutral / gold) | Ann. return % | Ann. vol % | Max DD % | Corr. to equities | 2022 return % |
|---|---|---|---|---|---|
| 25/75 | 12.38 | 11.59 | -9.73 | −0.07 | 4.68 |
| 30/70 | 11.38 | 11.25 | -8.84 | −0.12 | 5.77 |
| 50/50 | 7.33 | 10.89 | -9.80 | −0.33 | 10.07 |
| 70/30 | 3.22 | 12.19 | -15.35 | −0.48 | 14.30 |
| 75/25 | 2.19 | 12.73 | -17.89 | −0.50 | 15.35 |
Standalone market-neutral and gold sleeve, monthly returns 2021 to 2025, first round. The bond sleeve alone returned -0.72% a year at +0.63 correlation to equities over the current monthly window.
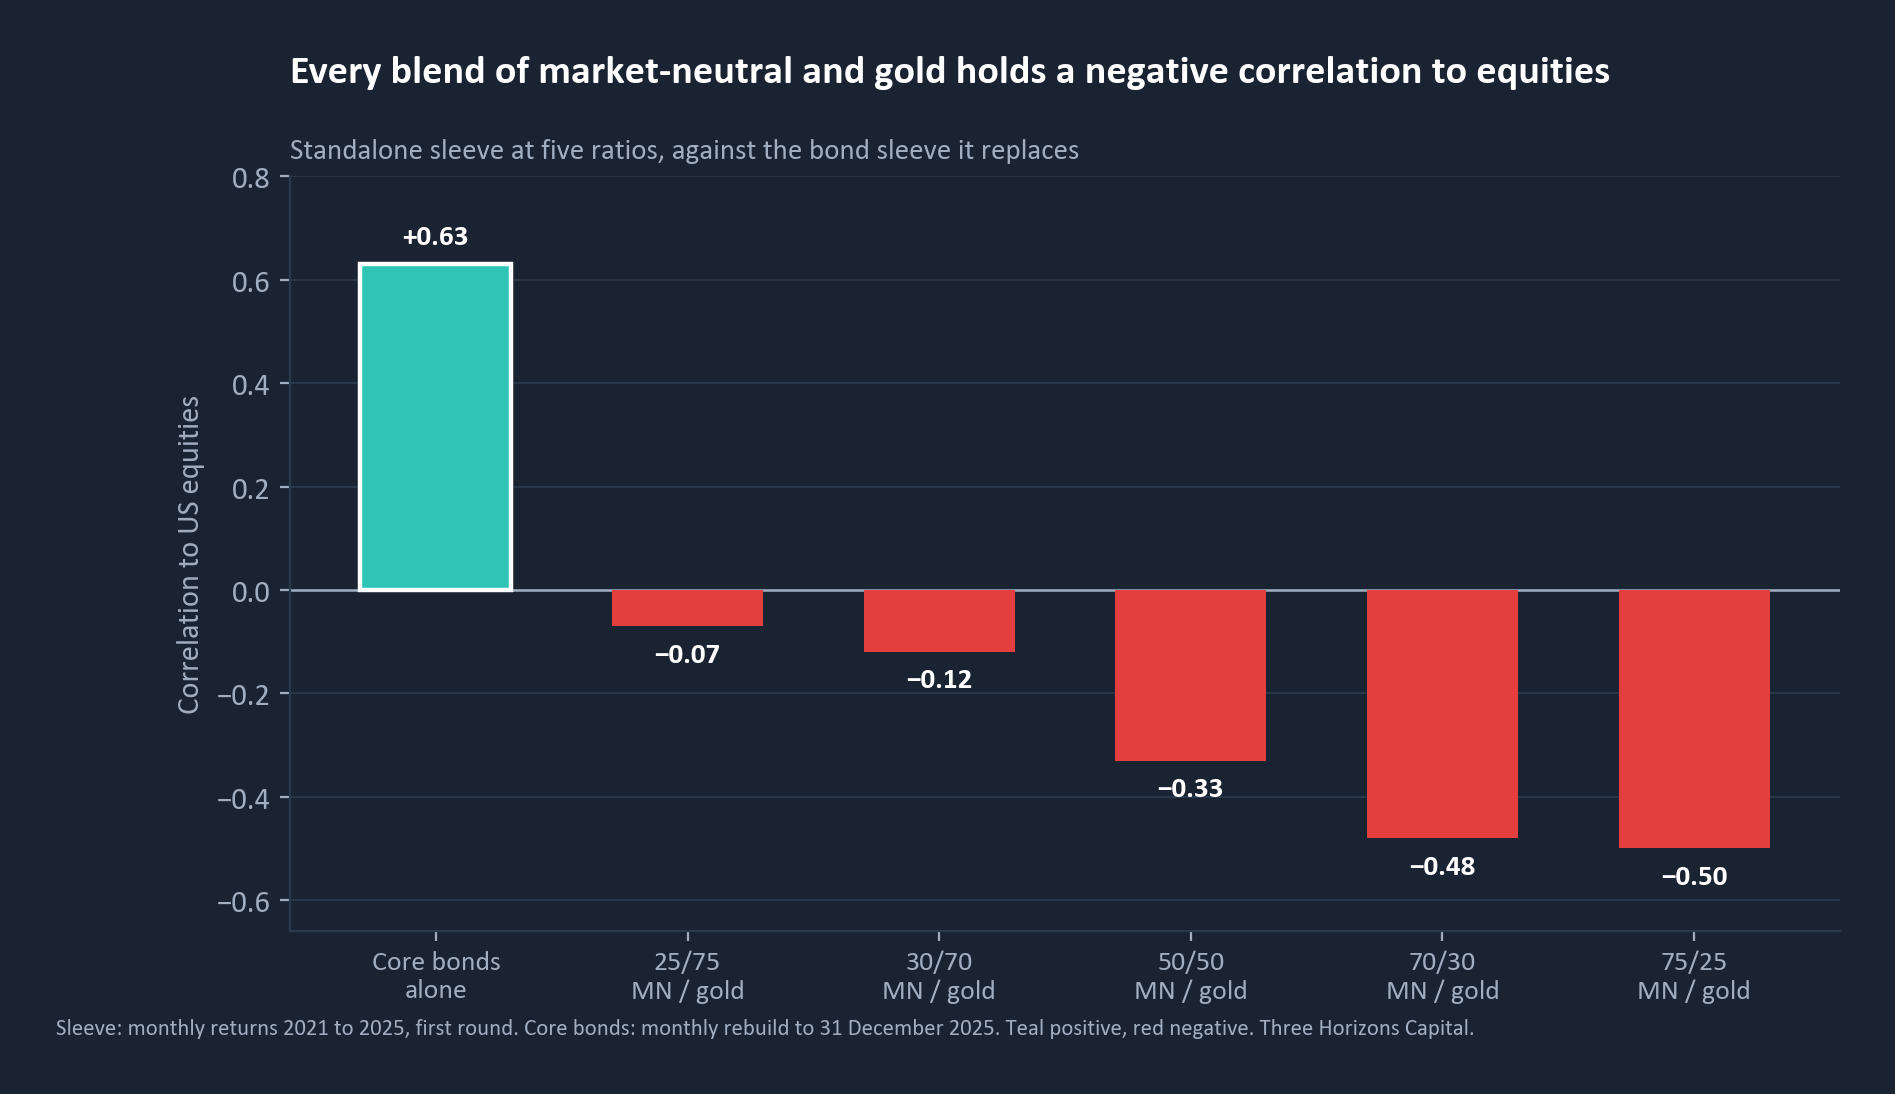
Every ratio holds a negative correlation to equities. More market-neutral buys a more negative correlation and a stronger 2022 at the cost of carry. More gold buys the carry back at the cost of hedge quality. It is a dial, not a single fixed answer.
At every equity weight tested, the barbell beat bonds on return, volatility and drawdown at once
The first round then validated the sleeve at the portfolio level, substituting the barbell for the bond sleeve at three equity weights, each at three barbell ratios, on monthly returns with monthly rebalancing.
| Portfolio | Ann. return % | Ann. vol % | Return / vol | Max DD % | Growth of $100 |
|---|---|---|---|---|---|
| 60/40 traditional, core bonds | 8.20 | 10.87 | 0.75 | -20.05 | 148.3 |
| 60/40 substituted, 25/75 | 13.99 | 9.89 | 1.41 | -15.89 | 192.5 |
| 60/40 substituted, 50/50 | 12.01 | 8.67 | 1.39 | -13.68 | 176.3 |
| 60/40 substituted, 75/25 | 10.01 | 7.87 | 1.27 | -11.45 | 161.2 |
| 70/30 traditional, core bonds | 9.70 | 11.89 | 0.82 | -21.01 | 158.8 |
| 70/30 substituted, 25/75 | 14.11 | 10.91 | 1.29 | -17.91 | 193.5 |
| 70/30 substituted, 50/50 | 12.63 | 9.99 | 1.26 | -16.28 | 181.3 |
| 70/30 substituted, 75/25 | 11.15 | 9.28 | 1.20 | -14.64 | 169.6 |
| 80/20 traditional, core bonds | 11.20 | 12.95 | 0.87 | -21.98 | 170.0 |
| 80/20 substituted, 25/75 | 14.19 | 12.16 | 1.17 | -19.93 | 194.1 |
| 80/20 substituted, 50/50 | 13.21 | 11.56 | 1.14 | -18.86 | 186.0 |
| 80/20 substituted, 75/25 | 12.23 | 11.04 | 1.11 | -17.78 | 178.0 |
Traditional core-bond portfolios against market-neutral and gold substituted portfolios, ratios shown as market-neutral / gold. Monthly returns 2021 to 2025, first round.
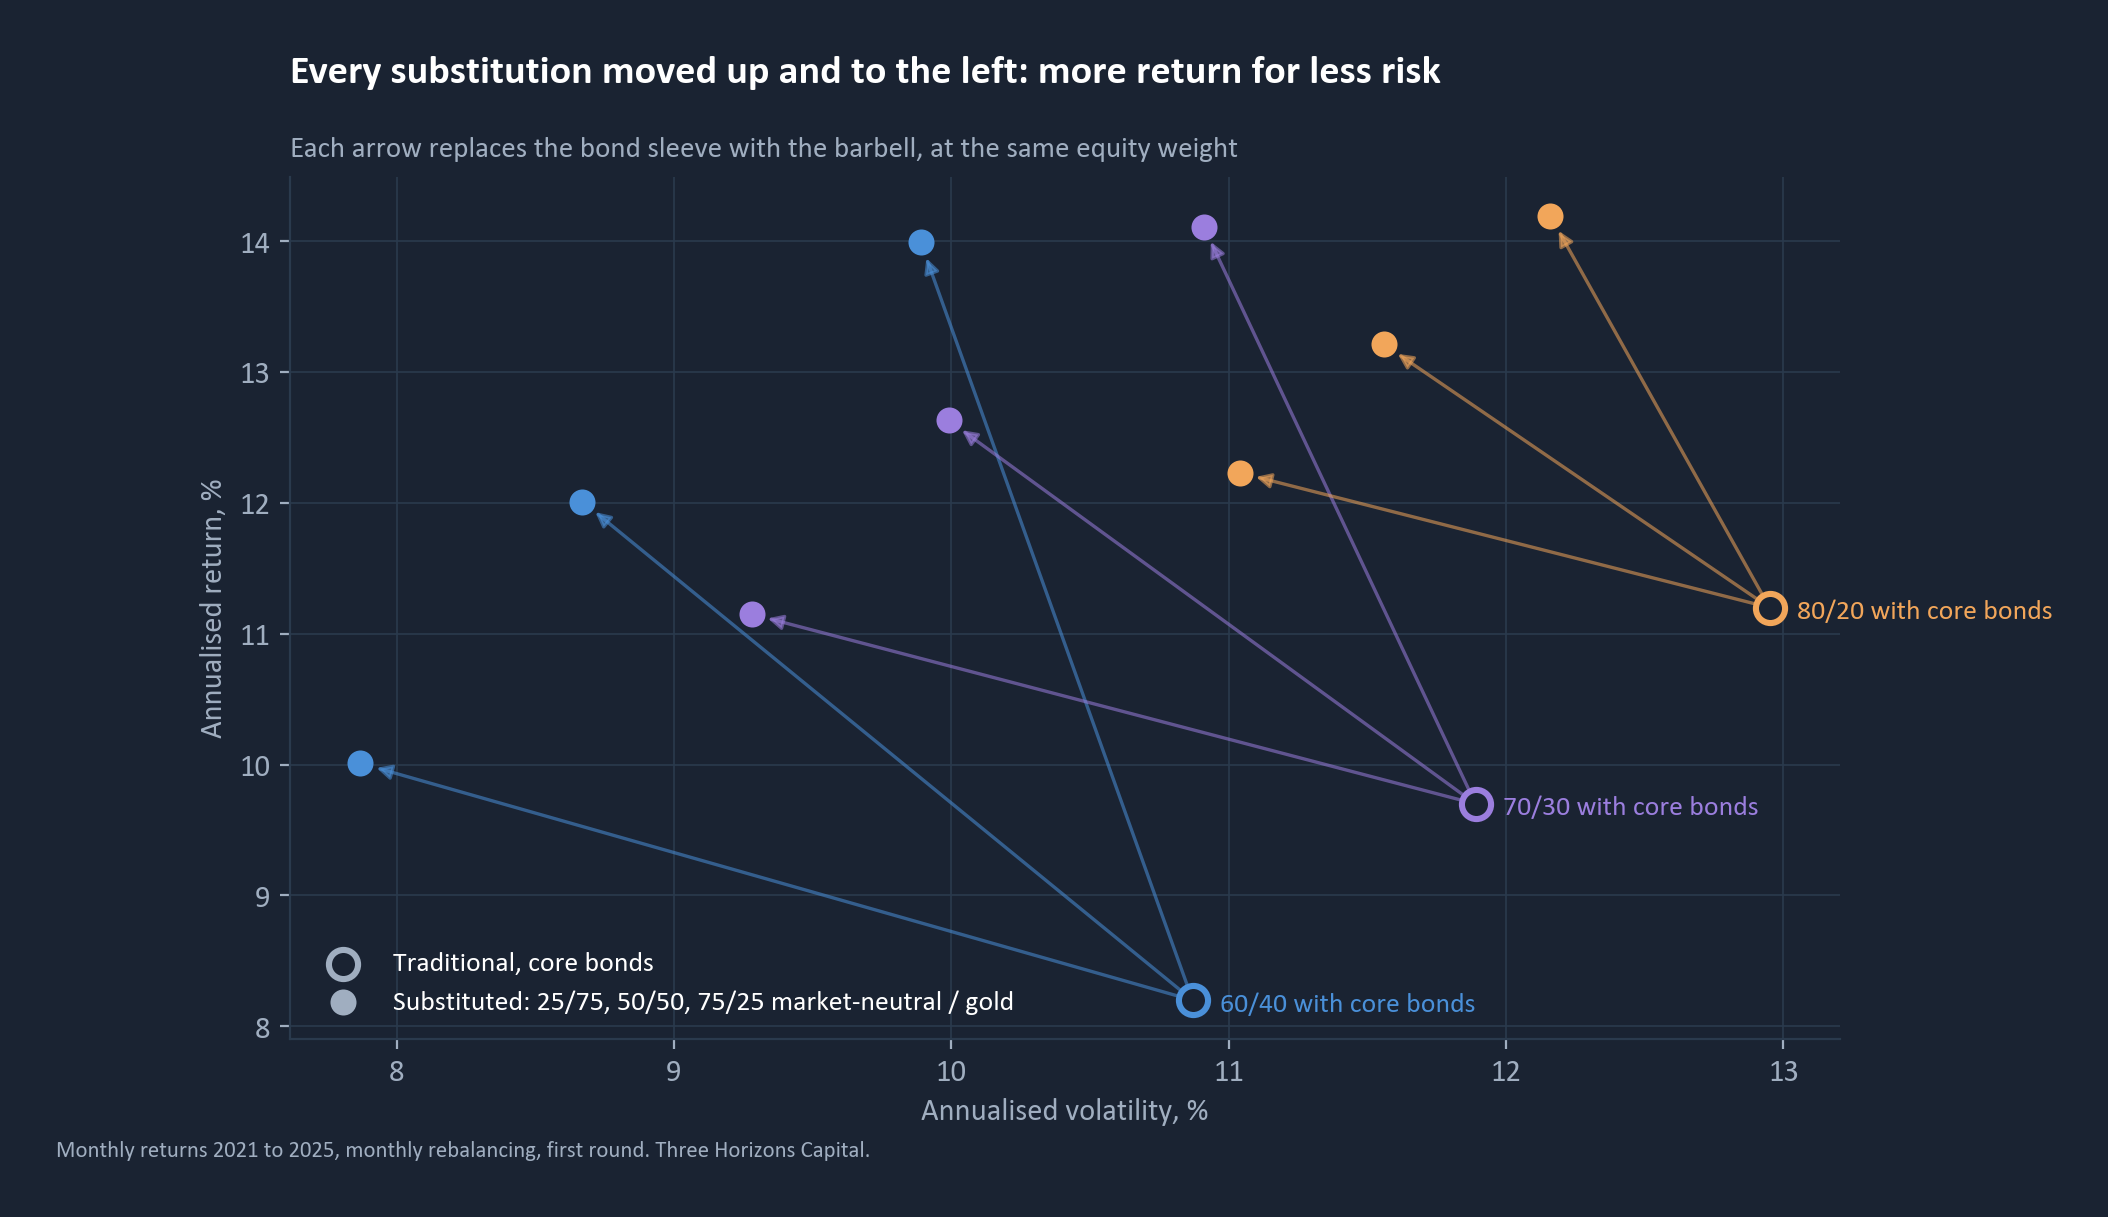
At every matched equity weight, the barbell improved return, volatility and drawdown simultaneously. Over this sample that is not a trade-off, it is outright dominance.
The blended portfolios' correlation to equities, 0.83 to 0.98 across the twelve mixes, looks high, and that is mechanical: equities are 60 to 80% of the book in every mix. The right diversification comparison is the standalone sleeve in section 06, where the substitute holds a negative correlation and the bond sleeve it replaces holds +0.63.
The equal split is the reference point, and the ratio is a dial for return give-up
The current round's confirmed reference point sits inside that ladder: a 60% equity book run as 60/20/20, an equal split between market-neutral and gold, on the monthly rebuild.
| Portfolio | Ann. return % | Ann. vol % | Growth of $100 | Max DD % | 2022 return % | Avg return, worst months % |
|---|---|---|---|---|---|---|
| 60/40 core bonds, baseline | 8.20 | 10.87 | 148.3 | -20.0 | -15.8 | -4.13 |
| 60/40 gold only | 15.95 | 11.41 | 209.6 | -18.1 | -11.0 | -3.39 |
| 60/40 market-neutral only | 8.00 | 7.62 | 146.9 | -9.2 | -3.0 | -1.97 |
| 60/20/20 barbell, equal split | 12.01 | 8.67 | 176.3 | -13.7 | -7.0 | -2.68 |
| 100% US equities | 14.21 | 15.12 | 194.4 | -23.9 | -18.2 | -5.49 |
60% equity book, monthly returns 2021 to 2025, as at 31 December 2025. Unchanged to the decimal from the first round, which was built on the same monthly return convention.
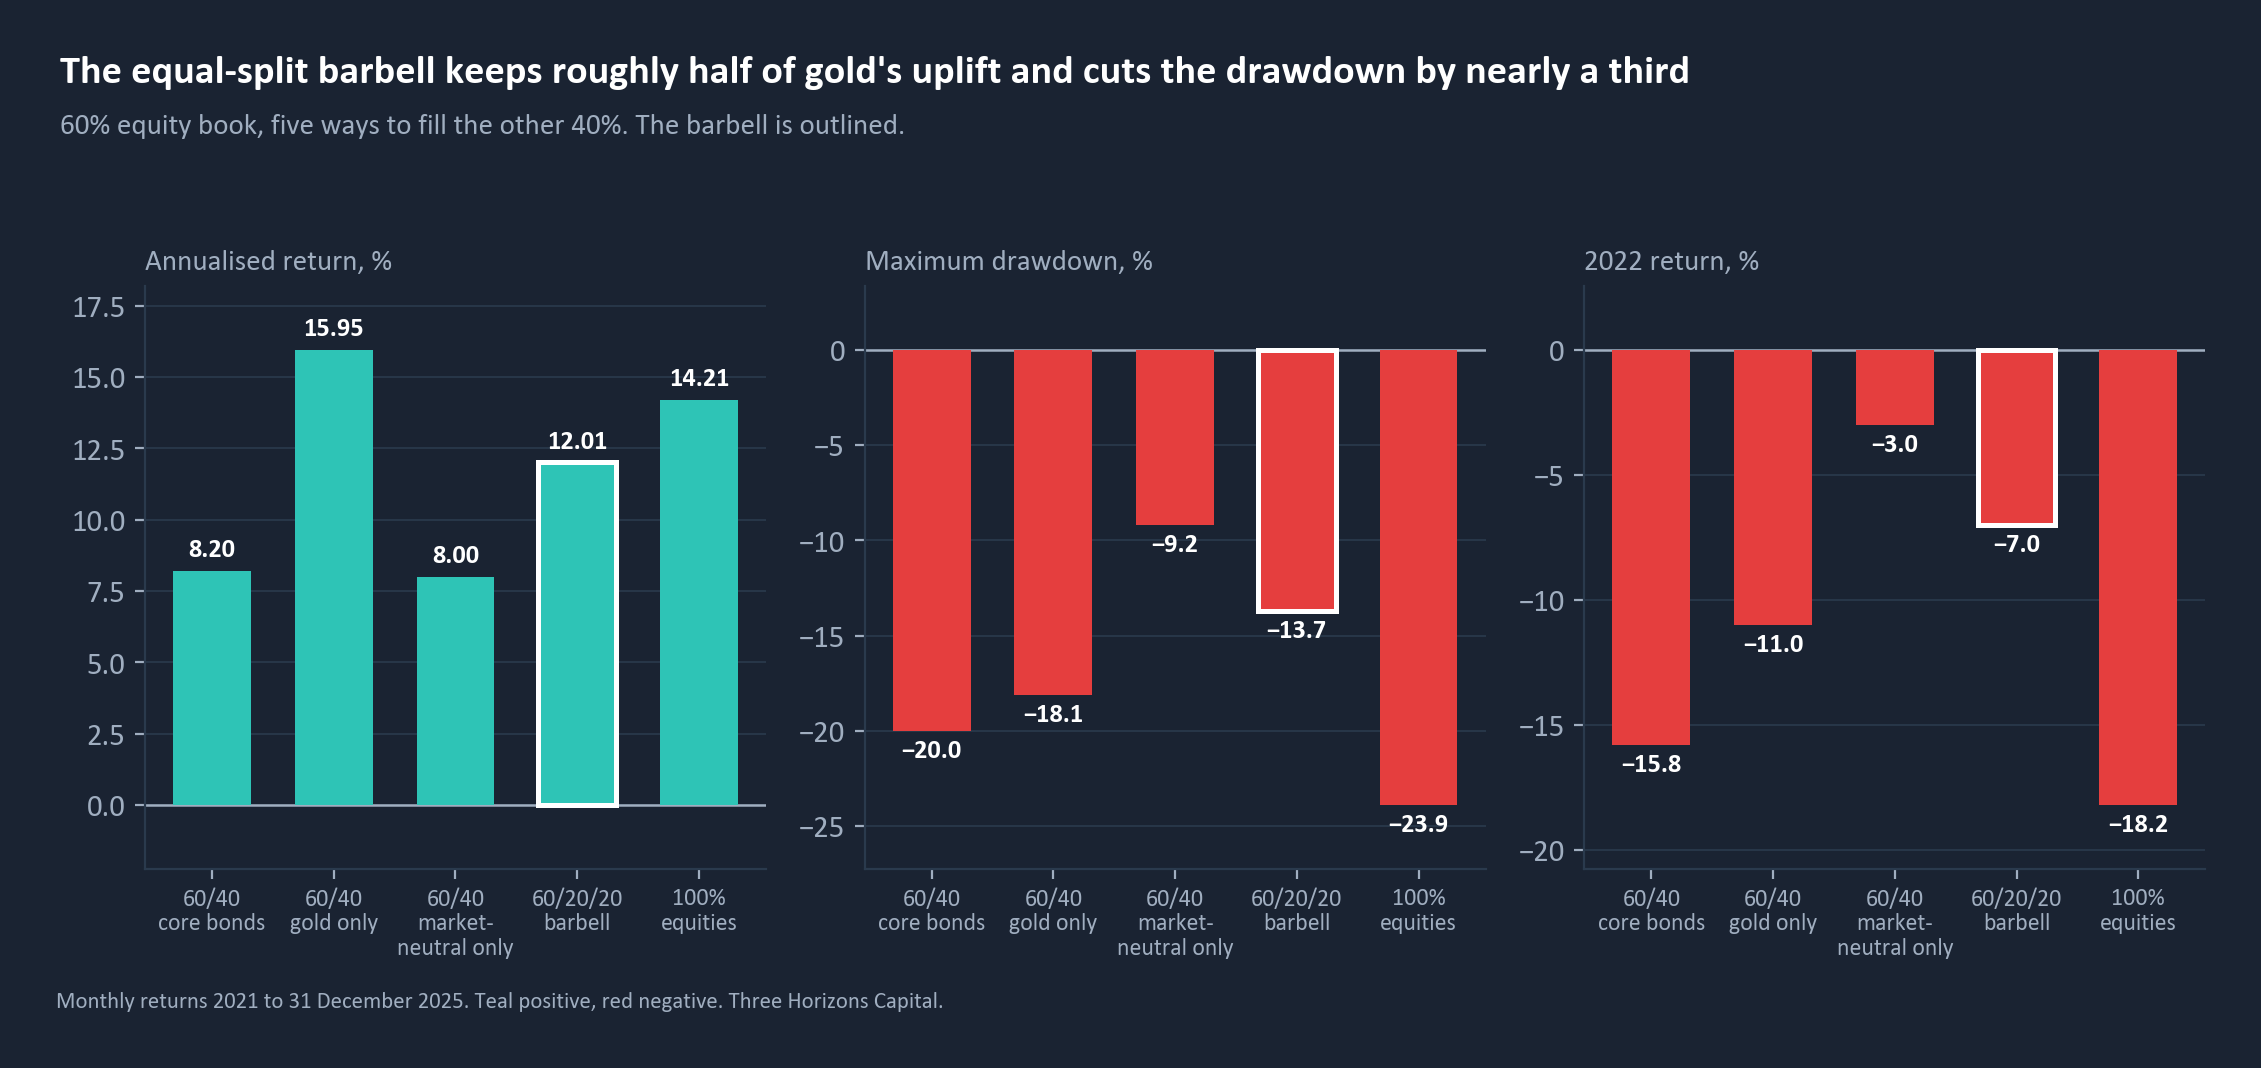
Gold alone wins on a straight return and volatility basis, but it keeps equity-correlated stress behaviour. Market-neutral alone is the most defensive single substitute, and it gives up the most return. The equal-split barbell splits the difference deliberately: it captures roughly half of gold's return uplift over the bond baseline, cuts maximum drawdown by nearly a third against bonds, and roughly halves the 2022 loss.
The 50/50 point is the confirmed reference case, computed twice, once in each round, with matching figures. The wider 25/75 to 75/25 ladder is the tuning range. A portfolio with less tolerance for giving up return can lean towards gold, for example 25/75 at 13.99% return and 9.89% volatility at 60% equity. A portfolio that prioritises crisis protection can lean towards market-neutral, for example 75/25 at 10.01% and 7.87%.
Capital is already rotating towards both legs, and faster into market-neutral than anywhere else
A diversifier's risk and return profile is half the underwriting question. The other half is whether the market is voting with capital, and how reliably. Fund flows by Morningstar category, January 2021 to July 2026, corroborate both legs of the recommendation independently of the backtest.
| Category | AUM $bn | Cum. flow $bn | TTM $bn | 2021 | 2022 | 2023 | 2024 | 2025 | 2026 YTD | Portfolios |
|---|---|---|---|---|---|---|---|---|---|---|
| Equity Market Neutral | 28.4 | 18.32 | 9.00 | 0.65 | 2.54 | -0.41 | 2.16 | 7.07 | 6.31 | 9→12 |
| Commodities Focused, incl. gold | 320.3 | 21.01 | 22.40 | -14.14 | -6.04 | -5.19 | 1.53 | 54.56 | -9.70 | 31→44 |
| Equity Precious Metals | 79.2 | -7.58 | 0.26 | -1.86 | 0.07 | 0.05 | -2.52 | 0.43 | -3.75 | 24→27 |
| Long-Short Equity | 36.5 | 12.09 | 6.71 | 0.72 | 0.96 | -0.19 | 1.29 | 5.92 | 3.38 | 23→31 |
| Macro Trading | 13.8 | 8.65 | 3.18 | 0.64 | 0.59 | 0.84 | 1.88 | 2.19 | 2.50 | 7→13 |
| Multistrategy | 67.8 | 29.73 | 18.31 | 4.34 | 3.45 | -3.48 | 2.26 | 8.84 | 14.31 | —→37 |
| Intermediate Core Bond | 1732.9 | 613.93 | 171.40 | 126.40 | 19.30 | 121.78 | 133.78 | 106.02 | 106.64 | 126→166 |
| Intermediate Core-Plus Bond | 1106.8 | 252.50 | 79.07 | 76.97 | -36.19 | 61.84 | 51.52 | 48.04 | 50.32 | 123→164 |
| Long-Term Bond | 44.2 | 0.45 | 1.27 | 0.78 | -1.69 | 5.68 | 6.90 | -12.22 | 1.00 | 13→16 |
Net flows in $bn. Cumulative flow January 2021 to July 2026. Portfolios counts distinct portfolios, 2021 to now.
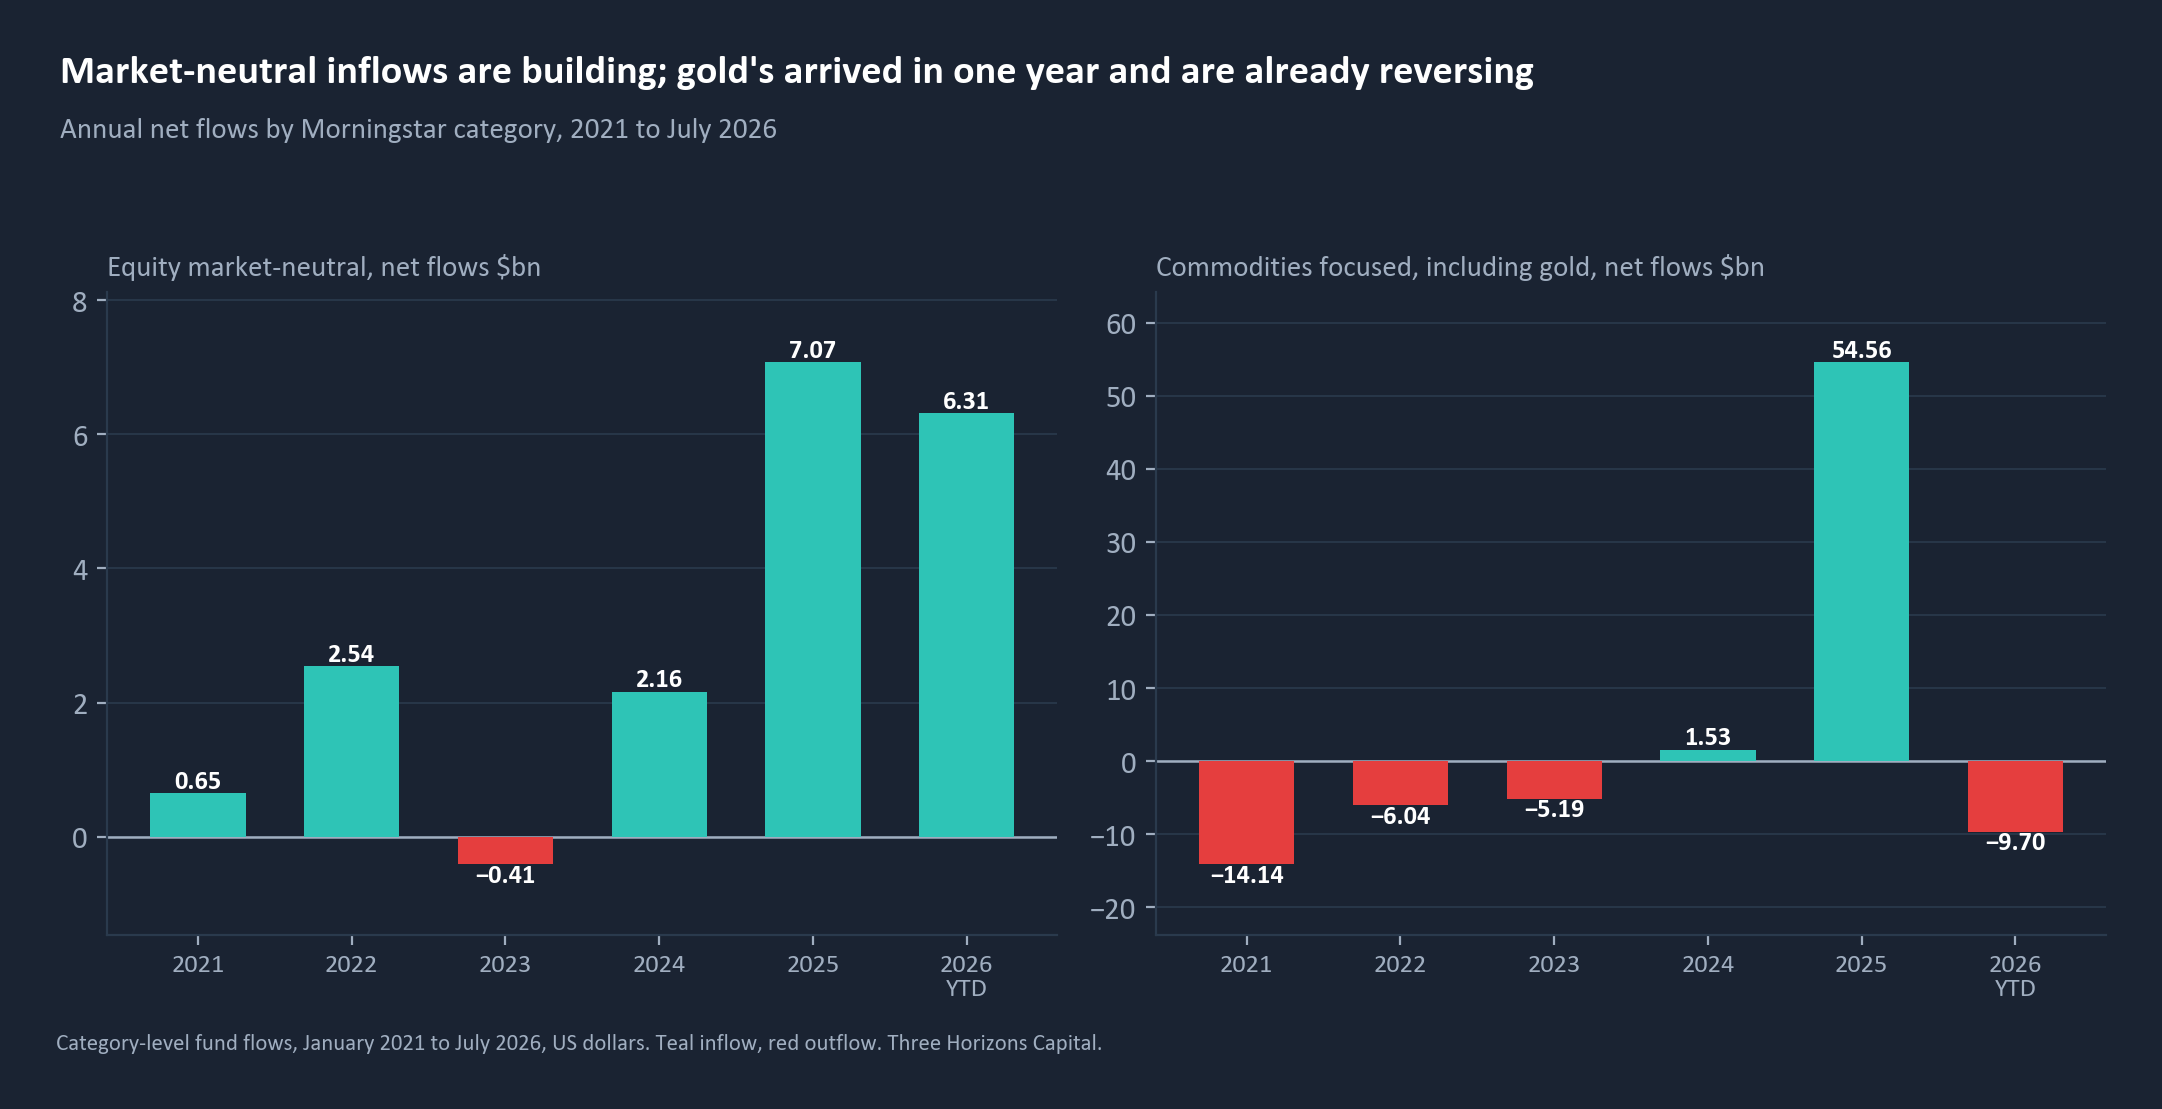
Market-neutral. Equity market-neutral funds have taken in $18.3bn of net new money since January 2021 against a current category size of $28.4bn, an organic growth rate of around 65%. That is the highest of any category examined, including core bonds at 35.4%. It is not a legacy 2021 spike that has since faded: trailing twelve-month flows annualise to 31.7% of current assets, so the trend is accelerating rather than decaying. Flows were positive in five of the last six years, with 2023 the lone, modest outflow at -$0.41bn, and manager supply has grown to meet demand, from 9 distinct portfolios to 12, up 33%.
Gold. The Commodities Focused category, which houses gold, gathered $21.0bn cumulatively, including a standout $54.6bn in 2025 that lines up with gold's rally, and 13 new portfolio launches, from 31 to 44, up 42%. It gave back -$9.7bn in 2026 to date, partial profit-taking after the rally and consistent with gold's edge being concentrated in one year rather than in structural demand. The narrower Equity Precious Metals category, gold mining equities rather than physical gold, saw net redemptions of -$7.6bn over the same period. The flow support is specific to gold and broad commodities, not to miners, which argues for holding gold through a bullion-backed vehicle rather than a mining-equity proxy.
Bonds still dominate in dollars. Intermediate Core Bond gathered $613.9bn over the same period, more than 20 times either alternative category. Intermediate Core-Plus Bond gathered $252.5bn, approximately 12 to 14 times. The argument is not that bonds are being abandoned. It is that the organic growth rate of the two recommended categories outpaces bonds' own, and that the growth is happening in exactly the two instruments the backtest independently selects.
Neither category's flow base suggests a capacity constraint at institutional allocation sizes. Market-neutral's much smaller asset base does mean its growth has scaled off a smaller starting point, and that should inform sizing.
Anchor the sleeve in market-neutral, complement it with gold, and build it in phases
Core hedge weight: market-neutral. Anchor the diversifier sleeve here. Of the two candidates with a persistently negative correlation to equities, market-neutral and trend-following managed futures, this paper selects market-neutral, not on correlation alone but because its flow profile, organic growth of around 65% since 2021 and still accelerating at a 31.7% trailing twelve-month rate, provides an independent demand signal the managed futures category does not match over this period. It returned +19.3 to 20.5%, weekly and monthly, in the 2022 sell-off while core bonds returned -13.0%. Size it to the return give-up the portfolio can tolerate, because it is the most expensive sleeve in absolute return terms.
Carry complement: gold, sized conservatively. Gold sits alongside market-neutral as a return-enhancing, loosely correlated diversifier, at 0.13 to 0.14 correlation to equities across frequencies, and not as insurance. Its edge is concentrated in 2025, and it was flat rather than protective in 2022 and in the worst equity months. Do not size gold off 2025's pace. Its category has already turned to net outflows in 2026 to date.
Starting ratio and tuning range. The reference point is an equal 50/50 split, 60/20/20 at a 60% equity weight: 12.0% return at 8.7% volatility, a -13.7% maximum drawdown and -7.0% in 2022, against the 60/40 baseline's 8.2%, 10.9%, -20.0% and -15.8%. That is +3.8 points of return, -2.2 points of volatility, 6.3 points less drawdown and an 8.8 point smaller 2022 loss. The 25/75 to 75/25 ladder remains the dial around it.
Portfolio-level effect. At every equity weight tested, 60/40, 70/30 and 80/20, and every barbell ratio tested, 25/75, 50/50 and 75/25, substituting the barbell for the bond sleeve raised return, lowered volatility and shrank maximum drawdown together over 2021 to 2025.
Flows. Allocators are already moving capital into market-neutral and commodities funds at organic growth rates that outpace core bond categories, and new product launches continue in both.
Implementation. The sample is short and contains a single major stress episode. Market-neutral carries a real return cost in calm, rising markets, roughly -3.0% to -3.6% a year over the full period, weekly and monthly, which should be underwritten as the price of insurance rather than treated as a flaw. The correlation regime and the flow picture, gold's especially, should be monitored and re-tested rather than assumed static. A phased build through liquid exchange-traded funds or comparable vehicles is preferable to an immediate full-size swap.
Bonds have not failed, but the job they did now needs two instruments, sized on purpose
Bonds have not failed as an asset class. They are behaving exactly as duration dictates in an inflation-dominant regime, where a rate shock hits equity valuations and bond prices at the same time.
Those mechanics point directly to the answer. The substitute is not another duration instrument, and not a single alternative fund. It is a deliberately sized combination of a genuine equity hedge, market-neutral, and a low-correlation return-enhancer, gold.
Two independent rounds of research reach that conclusion from different angles and different data vintages: a fourteen-candidate screen across six correlation clusters with a full ratio and equity-weight validation grid, then a rebuild of the core comparison on monthly returns to 31 December 2025. The mix ladder, the scorecard, the sizing ladder and the validation grid all point to market-neutral and gold, and the flows show capital already moving the same way, fastest into market-neutral.
The one figure the two rounds reported differently, gold's 2025 return, is reconciled at approximately 63.7 to 64% and does not change the direction of either leg. Until the inflation-dominant regime that broke the classic 60/40 reverses, this barbell is the practical, evidence and flow-supported substitute for the diversification bonds used to provide.
What we measured, and what we did not
This paper consolidates two rounds of Three Horizons Capital research. The first, Bonds' Broken Hedge, screened fourteen candidate substitutes across six correlation clusters, built the market-neutral and gold ratio ladder, and ran the three-equity-weight validation grid on 2021 to 2025 returns at mixed weekly and monthly frequency. The second, What Replaces Bonds?, rebuilt the core comparison of core bonds, gold, market-neutral and US equities on monthly returns as at 31 December 2025. Where the two overlap, the paper leads with the monthly rebuild. Where the first round covered ground the second did not revisit, its results are carried forward unchanged and labelled by frequency. Fund flows run from January 2021 to July 2026.
The frequencies are mixed by design, as a cross-check between the two rounds, and both readings are kept rather than silently resolved to one.
| Metric | Weekly, first round | Monthly, rebuild | Annual, eight years |
|---|---|---|---|
| Core bonds, annual return | -0.33% | -0.72% | — |
| Core bonds to equities, correlation | 0.26 | 0.63 (0.627 independent cross-check) | 0.71 |
| Gold, annual return | 18.69% | 17.31% | — |
| Market-neutral, annual return | -3.63% | -3.00% | — |
| Market-neutral, 2022 return | +19.3% | +20.5% | — |
Small differences between frequencies are expected, a known effect of return-interval aggregation, and none changes a sign or a conclusion.
Two figures in the earlier papers are reconciled here and the reconciled figures should be used: the five-year and eight-year labels on the inflation-linked Treasury correlation, which were transposed in the original, and gold's 2025 return, at approximately 63.7 to 64%.
The 1986 to 2020 comparison is Aswath Damodaran's data at NYU Stern as charted by the Financial Times. It is cited for context, not re-derived from our data, and it enters no return or risk calculation here. Every instrument is represented by a liquid exchange-traded fund, and category flows are as classified by Morningstar.
This paper is for information only. Prepared by Three Horizons Capital, it is research, not investment advice, and no security or fund is recommended. Past performance over a short sample that contains one major stress episode does not predict future returns. Figures are as at the dates stated.
If this is useful
We build this kind of test for managers and allocators who need a portfolio decision to survive a challenge rather than a first reading. If the question in front of you is what now does the job your bond sleeve used to do, that is the work we do.
Important information
This paper is for information only. Prepared by Three Horizons Capital, it is research, not investment advice, and no security or fund is recommended. Past performance over a short sample that contains one major stress episode does not predict future returns. Figures are as at the dates stated.