Portfolio construction
What a Sharia-Compliant 60/40 Actually Buys
Sukuk and Sharia-screened equity, measured against their conventional twins over 1,685 trading days.
Three Horizons Capital · September 2026
4.52%
the sukuk sleeve's volatility measured monthly, against the 2.29% the daily series reports
0.116
correlation between the sukuk sleeve and its own equity sleeve, against 0.432 for the conventional pair
30bp
the annual cost of compliance in this pairing, almost all of it on the equity side
The finding in one line
Compliance is the constraint; composition is the exposure. The screen itself changes very little on the equity side and a great deal on the fixed-income side, and the Sharia-compliant 60/40 runs at lower volatility than the conventional one for a reason the label does not advertise.
The answer, first
A Sharia-compliant 60/40 is close to a straight relabelling of the conventional one. Swap a broad US equity ETF for its Sharia-screened equivalent and a hard-currency emerging-market sovereign fund for a global sukuk fund, hold the weights, and the resulting portfolio tracked a conventional 60/40 at a correlation of 0.958 over the last six and three-quarter years. It returned more and it drew down less.
That is the easy part, and it is where most analysis of this question stops.
The harder part is why, and the answer is not the one the label suggests. The screen itself does very little. What does the work is what ends up in the portfolio once the screen has run, and on the two sides of the 60/40 that amounts to two entirely different things. On the equity side the screened fund is a near-twin of its conventional parent. On the fixed-income side it is a different book altogether: shorter, higher quality, and far less connected to equities.
Compliance is the constraint. Composition is the exposure. An allocator who buys the first and does not read the second is holding a portfolio they did not choose.
One more finding runs underneath all of it. Roughly half of the sukuk sleeve's famously low volatility is a measurement artefact. Measured daily it runs at 2.3%. Measured monthly, where the artefact washes out, it runs at 4.5%. Any risk budget sized off the daily number is wrong by about a factor of two, and in the direction that hurts.
01. The screen removes names. It is what remains that changes the risk.
A sukuk certificate represents beneficial ownership in an asset, a lease or a project. The holder receives rental or profit-rate cash flow rather than interest, which is what makes the instrument compliant. In the market it prices and trades like a bond: a yield, an effective duration, a spread over a sovereign curve. That is why a direct comparison against conventional fixed income is meaningful rather than a category error.
But structure is not exposure. Two funds can both be compliant and hold entirely different risk.
To test this properly the comparison has to be like for like, so this paper uses four funds and one window. On the equity side, a Sharia industry-exclusions S&P 500 fund against a core S&P 500 tracker. On the fixed-income side, a global sukuk ETF against a hard-currency emerging-market sovereign ETF, which holds conventional bonds from many of the same issuers. All four are US dollar, all four are exchange-traded, and all four are measured over the same 1,685 trading days from 27 December 2019 to 11 September 2026, the longest window the youngest of them supports.
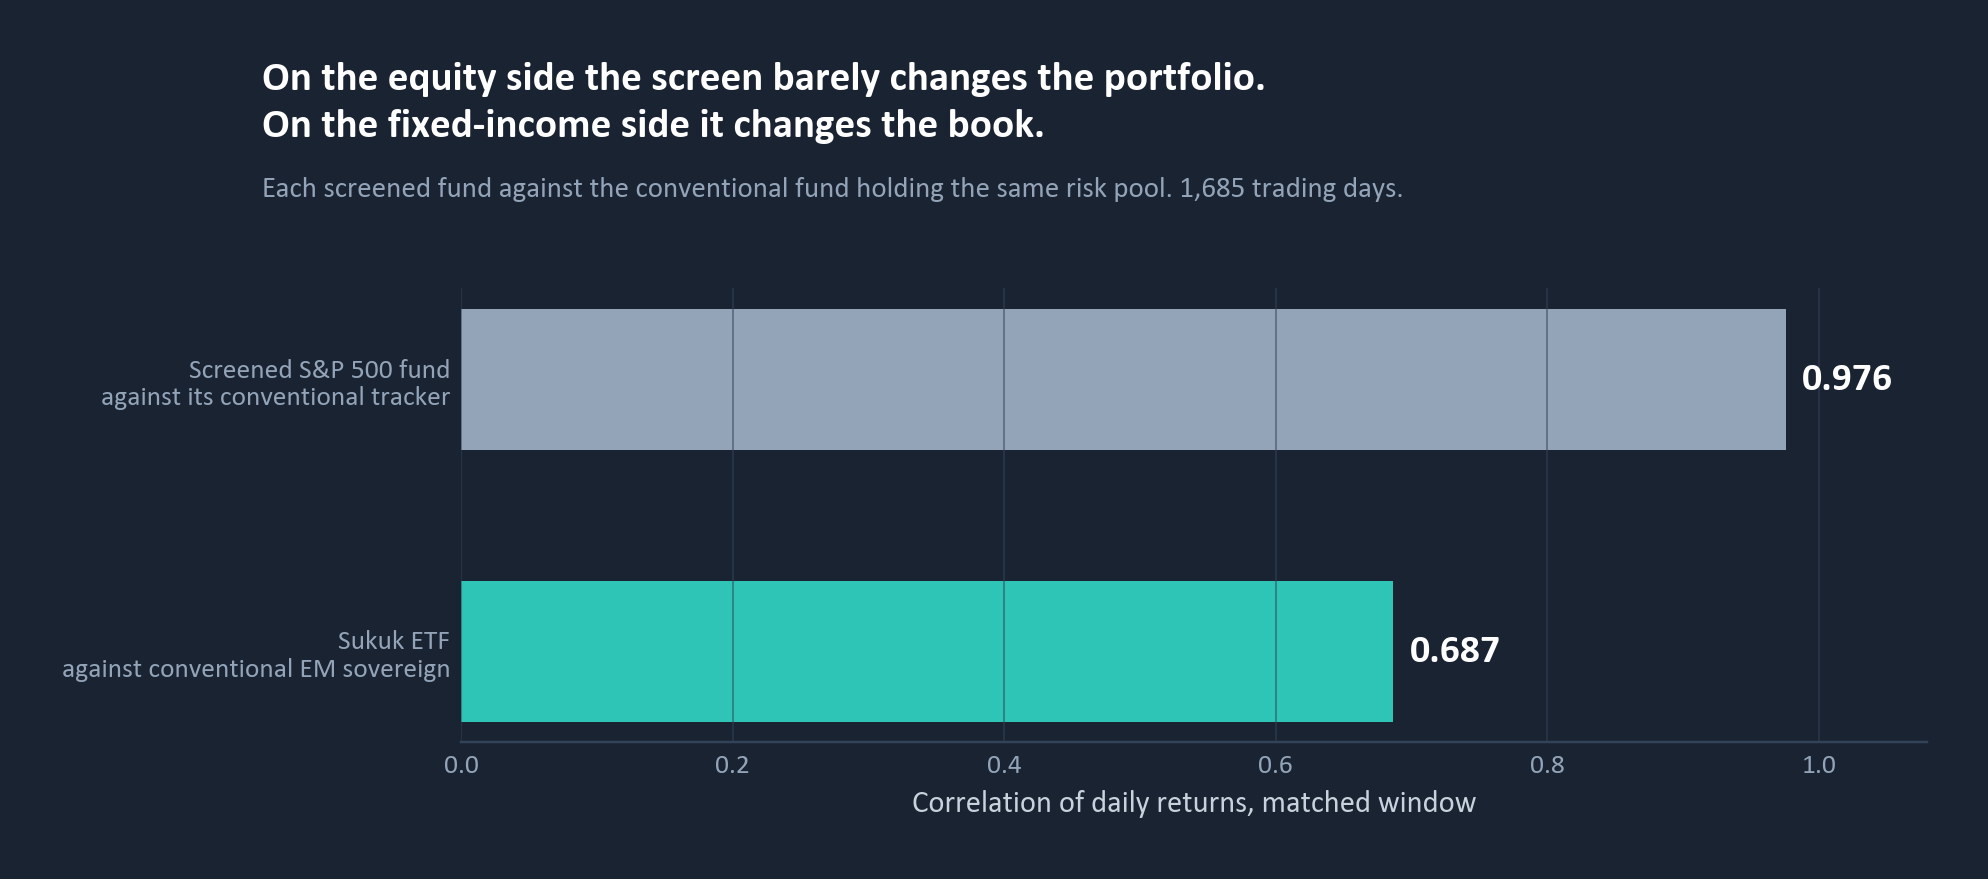
Figure 1. On the equity side the screen barely changes the portfolio. On the fixed-income side it changes the book.
02. On the equity side, the screen changes almost nothing.
The Sharia-screened S&P 500 fund and the conventional tracker moved together at a correlation of 0.976. Over the window the screened fund returned 18.27% annualised against 15.42%, at 22.16% volatility against 20.25%.
It is tempting to read that gap as the screen adding value. It does not survive testing.
Run the factor model and the screened fund shows a market beta of 1.497, which would make it a geared version of the index. That coefficient sits in the same regression as a -0.333 loading on value and -0.172 on financials, and those three proxies move together closely enough that the individual coefficients cannot be read on their own. Only their combined contribution can.
Measured directly, over the same 332 weeks, the screened fund's realised beta to the conventional tracker is 1.03. It is not a geared book. Its reported alpha of 1.01% a year does not clear significance, with a t-statistic of 1.35.
What the screen does do is change the composition, and the category classification records it plainly: the screened fund sits in Large Growth, the conventional tracker in Large Blend. Excluding conventional financials and heavily indebted balance sheets removes most of one sector and tilts what remains toward technology and growth. The return difference is that tilt. It is a sector bet the investor did not explicitly place, and it will not always pay.
So what: on the equity side, a Sharia screen is a style decision wearing a compliance label. Underwrite it as a style decision.
03. On the fixed-income side, the screen changes the book.
Here the same test gives the opposite answer. The sukuk ETF and the emerging-market sovereign ETF correlate at 0.687 on daily data, well below the equity pair's 0.976. That is not a screened version of the same portfolio. It is a different portfolio.
Over the matched window the sukuk ETF returned 1.03% annualised at 2.29% volatility, against the conventional fund's 1.82% at 7.77%. The sukuk sleeve gave up 79 basis points of annual return and drew down less than half as far, losing 12.82% at worst against 28.60%. Both were poor absolute returns: this window opens at near-zero yields and runs through the 2022 rate shock, so neither number should be read as a forward expectation.
The fixed-income analytics show exactly where the difference sits.
| Current portfolio, 17 September 2026 | Sukuk ETF | Conventional EM sovereign ETF |
|---|---|---|
| Yield to maturity | 5.53% | 6.41% |
| Effective duration | 4.08 years | 6.42 years |
| Average credit quality | BBB+ | BB+ |
| Below investment grade | 23.6% | 48.6% |
| Spread over the sovereign curve | 76bp | 157bp |
The conventional fund carries 57% more duration and twice the sub-investment-grade weight. It is not surprising that it is more volatile, and it has nothing to do with Sharia compliance. It is a duration and credit difference that happens to sit on either side of a compliance line, because the compliant universe is dominated by Gulf sovereigns and supranationals that issue shorter and at higher ratings.
The corollary matters more than the observation. Compliance did not make the sukuk sleeve safer. The composition of the compliant universe did. If that universe changes, with more corporate issuance, longer tenors or weaker sovereigns, the safety goes with it, and nothing about the compliance label will signal that it has.
So what: underwrite a sukuk sleeve on its duration and credit, exactly as you would any other bond fund. The label carries no risk information.
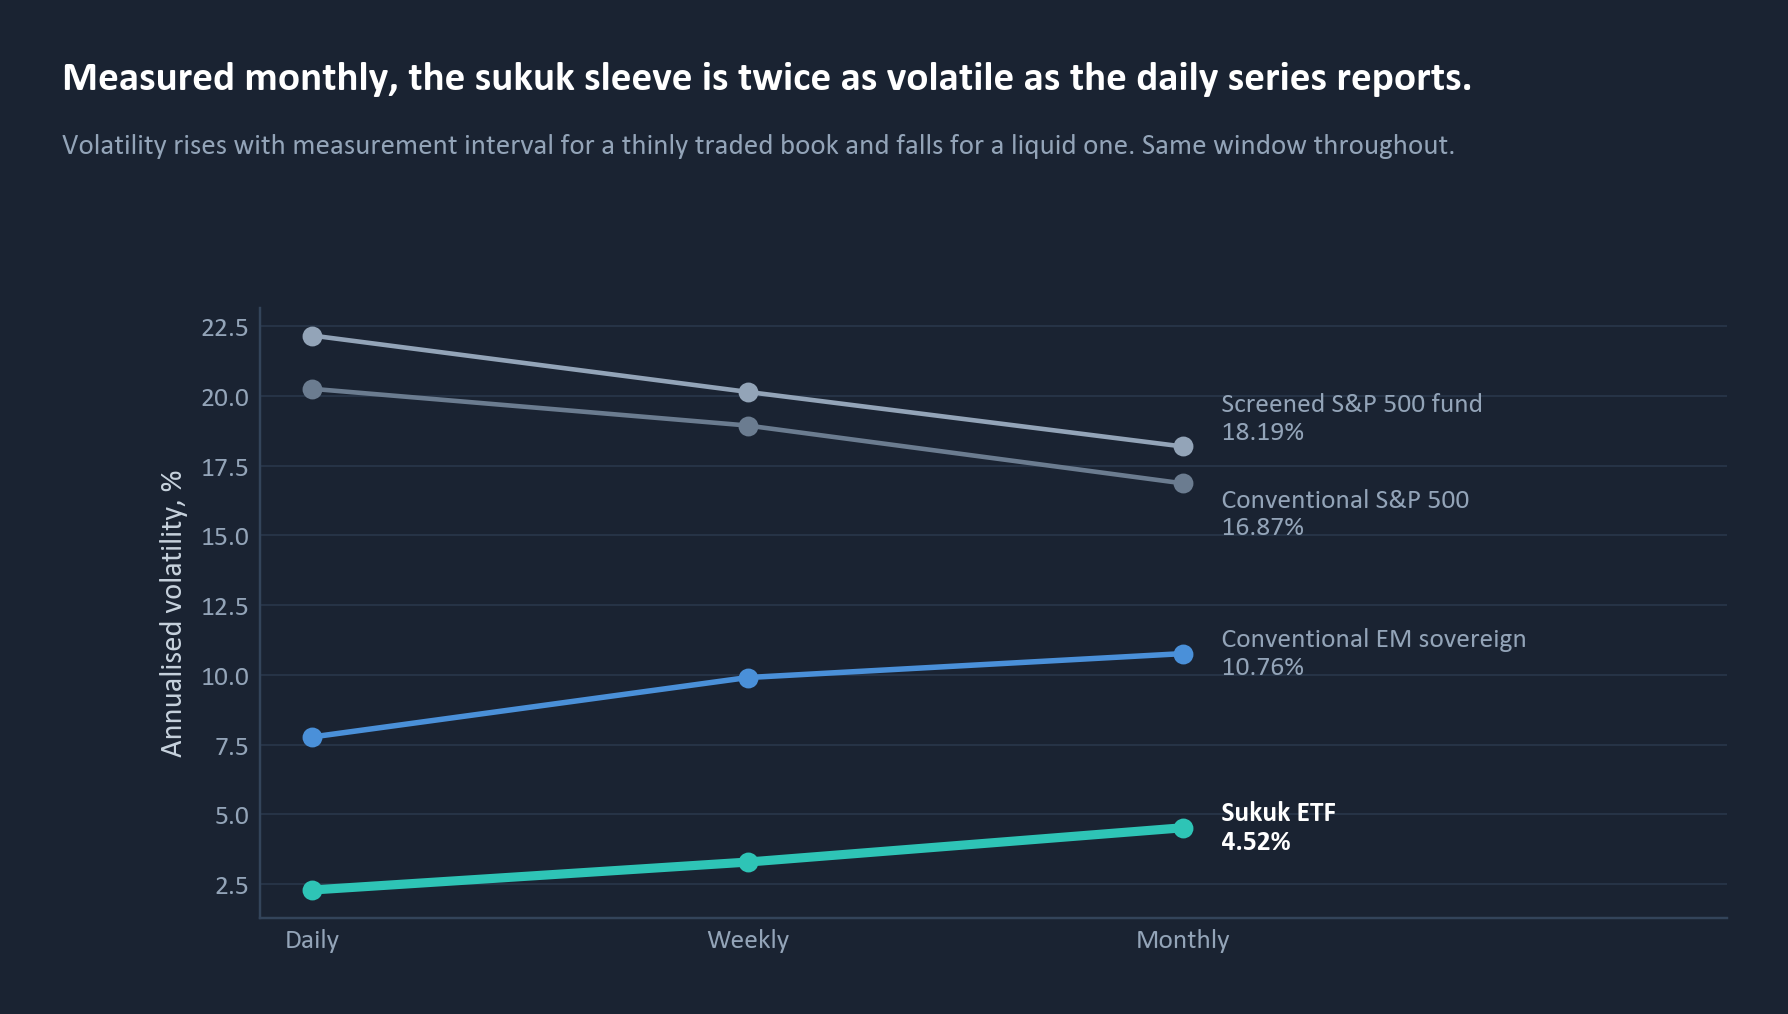
04. About half of sukuk's calm is a measurement artefact.
The sukuk ETF reports 2.29% annualised volatility against the conventional fund's 7.77%. On that reading it is the least volatile thing in the comparison by a wide margin.
It is not. The number is depressed by how the book is priced.
A thinly traded portfolio does not reprice every day. Some positions carry yesterday's mark, so today's move is partly tomorrow's, and the measured daily variance is smaller than the real variance. The signature is unmistakable and easy to test for.
| Matched window | Lag-1 return autocorrelation | Days moving less than 1bp |
|---|---|---|
| Sukuk ETF | +0.398 | 9.1% |
| Conventional EM sovereign ETF | +0.254 | 3.1% |
| Screened S&P 500 fund | -0.169 | 0.8% |
| Conventional S&P 500 tracker | -0.166 | 1.4% |
Both equity funds show the mild negative autocorrelation of a liquid book. The sukuk ETF shows the opposite, at more than twice the strength of the conventional bond fund, and a Ljung-Box test rejects independence below p=0.0001.
The correction is straightforward: measure over a longer interval, where the smoothing has had time to wash through.
| Annualised volatility | Daily | Weekly | Monthly | Monthly ÷ daily |
|---|---|---|---|---|
| Sukuk ETF | 2.29% | 3.29% | 4.52% | 1.97x |
| Conventional EM sovereign ETF | 7.77% | 9.90% | 10.76% | 1.38x |
| Screened S&P 500 fund | 22.16% | 20.15% | 18.19% | 0.82x |
| Conventional S&P 500 tracker | 20.25% | 18.94% | 16.87% | 0.83x |
The sukuk sleeve's honest volatility is 4.5%, not 2.3%. The equity funds move the other way, as liquid instruments do. The conventional bond fund sits between the two, which is the point: this is a liquidity gradient, not a sukuk peculiarity, and the sukuk sleeve simply sits at the far end of it.
Figure 2. Measured monthly, the sukuk sleeve is twice as volatile as the daily series reports.
Two practical consequences follow. A vol-target or risk-parity process fed daily data will size a sukuk sleeve at roughly double the position it should hold. And anyone scaling the sleeve to match a conventional fund's risk needs 2.38x on monthly data, not the 3.40x the daily series implies. That is a 43% overstatement of the leverage required.
So what: size a sukuk sleeve on monthly data. If your risk system only takes daily inputs, apply the correction by hand and document it.
05. The substitution works, and for a reason the label does not advertise.
Now the question that matters to anyone building this. If a conventional 60/40 holds 60% broad US equity and 40% hard-currency emerging-market sovereign debt, what do the Sharia-compliant weights have to be to match it?
Almost exactly the same. There is no clever weighting to find.
| Construction | Equity | Return | Volatility | Sharpe (rf=0) | Max drawdown | Tracking error |
|---|---|---|---|---|---|---|
| Target: conventional 60/40 | 60.0% | 10.22% | 13.78% | 0.74 | -28.83% | n/a |
| Naive relabelling | 60.0% | 11.69% | 13.44% | 0.87 | -21.23% | 3.95% |
| Minimum tracking error | 58.0% | 11.35% | 13.00% | 0.87 | -20.72% | 3.92% |
| Volatility matched | 61.6% | 11.97% | 13.78% | 0.87 | -21.64% | 4.00% |
| Return matched | 51.4% | 10.22% | 11.57% | 0.88 | -19.52% | 4.18% |
The mathematically optimal answer, 58/42, is barely distinguishable from simply keeping 60/40. The naive relabelling tracks at 3.95% against the optimum's 3.92%. With two instruments you cannot hit return, volatility and drawdown simultaneously, and you do not need to: every construction lands in the same neighbourhood.
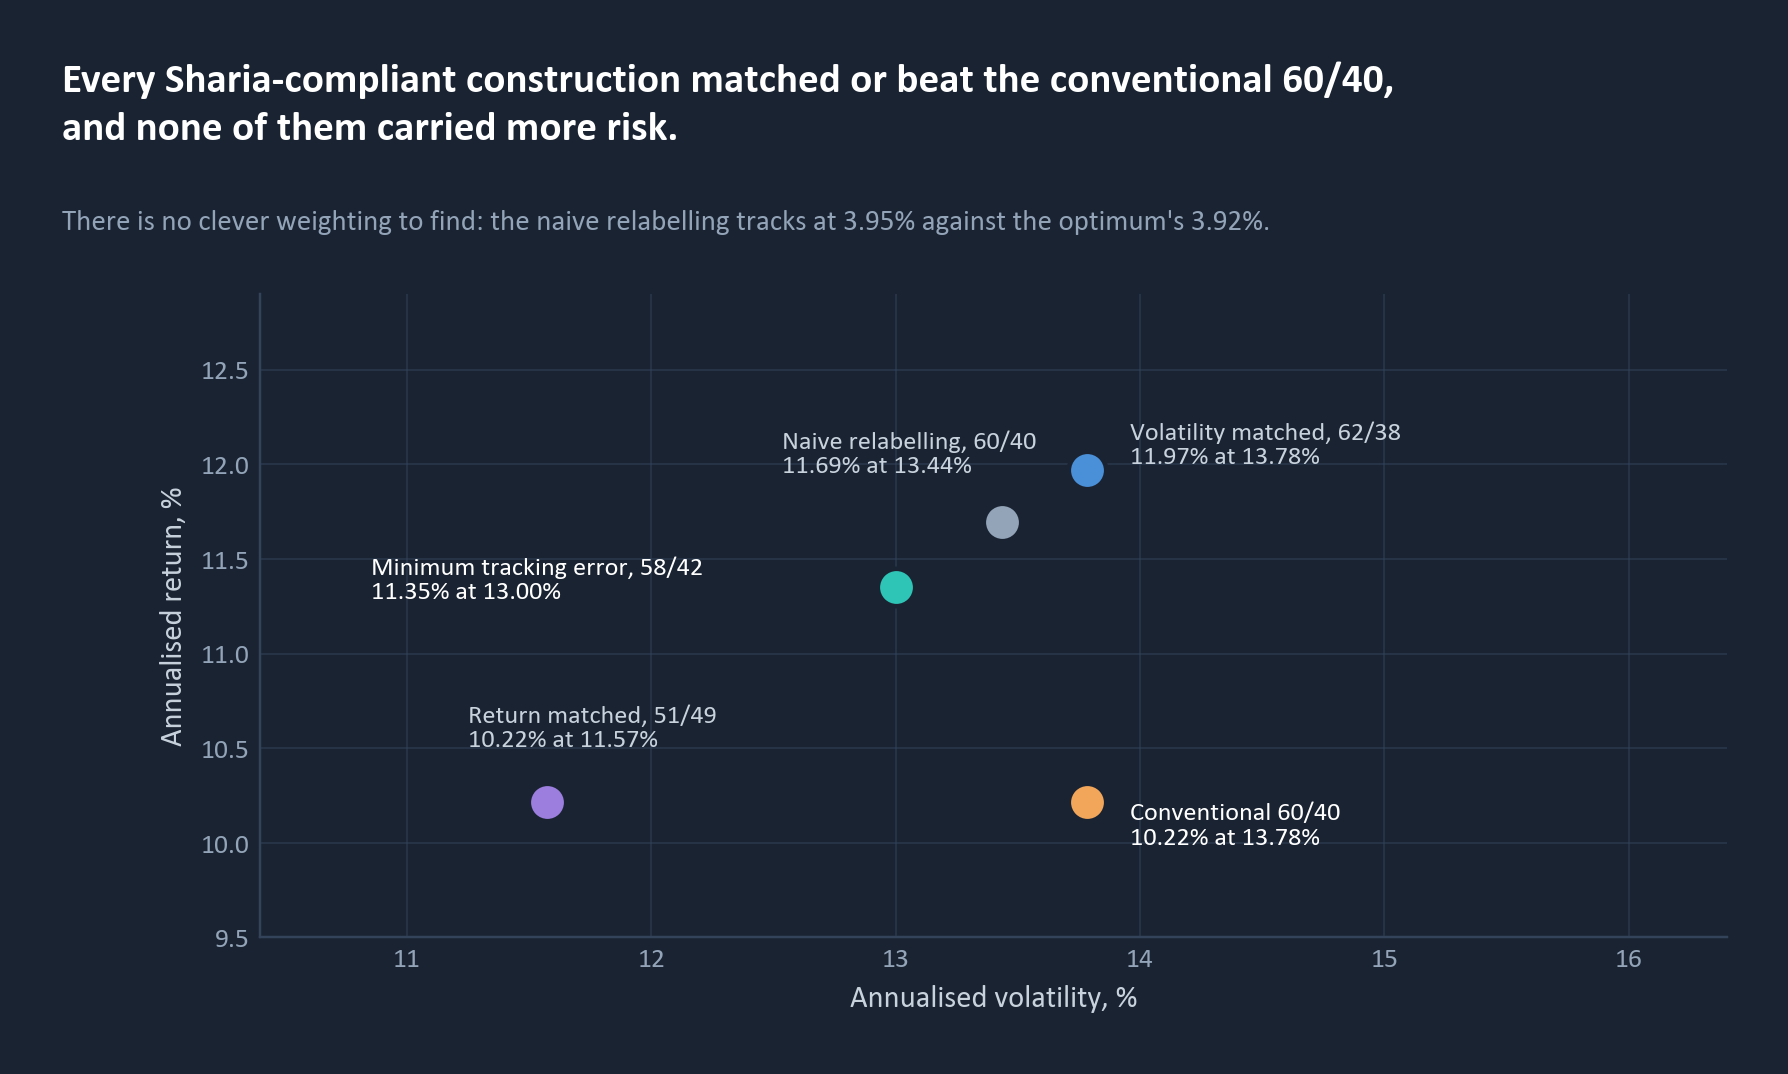
Figure 3. Every Sharia-compliant construction matched or beat the conventional 60/40, and none of them carried more risk.
The interesting part is why the blend runs lower volatility. It is not because the sukuk sleeve is quiet, which section 04 has already discounted. It is because of a correlation that sits outside the comparison this question is normally framed around.
In a 60/40, the bond sleeve's job is not to be calm on its own. Its job is to diversify the equity sleeve. So the number that matters is the correlation between the two sleeves you actually hold.
| Daily, matched window | Correlation |
|---|---|
| Conventional bond sleeve against conventional equity sleeve | 0.432 |
| Sukuk sleeve against Sharia-screened equity sleeve | 0.116 |
That is the mechanism. The Sharia-compliant blend carries a higher-volatility equity sleeve, 22.16% against 20.25%, and still lands at lower portfolio volatility, because the cross term between its two sleeves nearly disappears.
The obvious challenge is that 0.116 might be the same smoothing artefact from section 04, in which case the advantage is illusory. Tested across measurement intervals, it is not. It grows.
| Sukuk vs screened equity | Conventional pair | Target vol | Compliant blend vol | Difference | |
|---|---|---|---|---|---|
| Daily | 0.116 | 0.432 | 13.78% | 13.44% | -35bp |
| Weekly | 0.394 | 0.626 | 14.18% | 12.66% | -152bp |
| Monthly | 0.608 | 0.766 | 13.70% | 12.10% | -160bp |
Both correlations rise as the interval lengthens, exactly as the smoothing diagnosis predicts. But the gap between them persists, and the portfolio-level advantage widens from 35 basis points to 160. The fund-level caution and the portfolio-level conclusion are both true, and they are not in conflict.
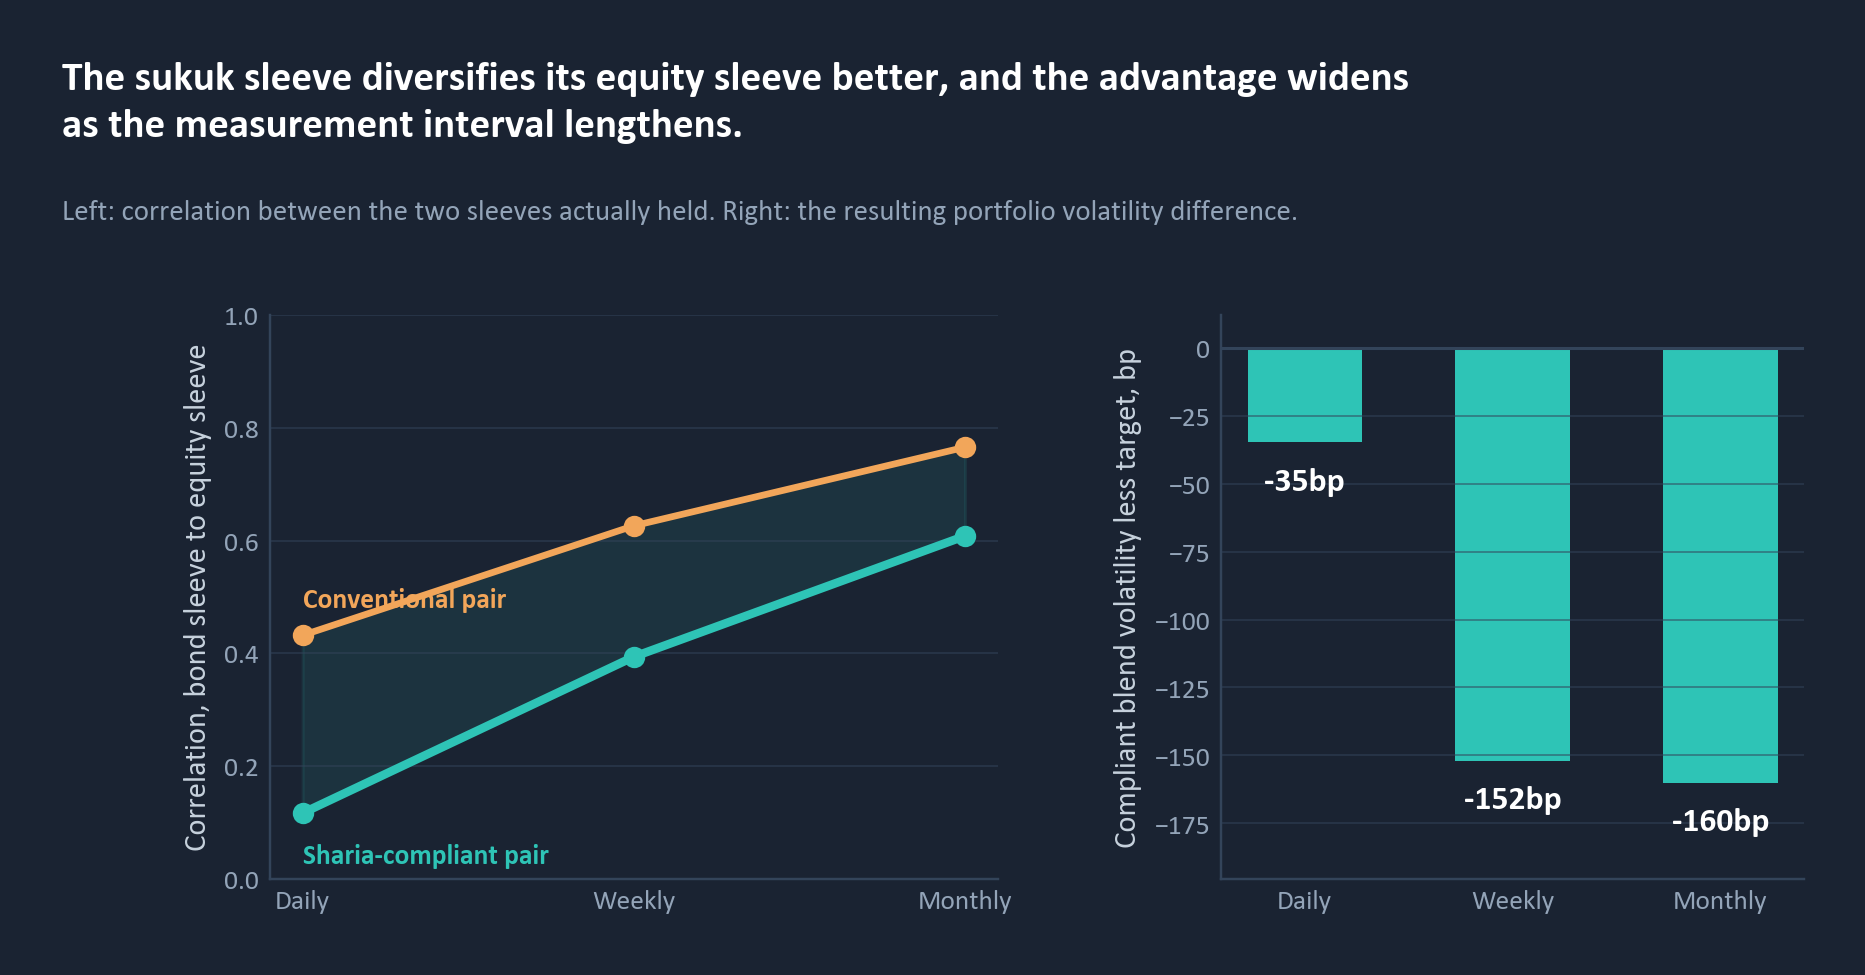
Figure 4. The sukuk sleeve diversifies its equity sleeve better, and the advantage widens as the measurement interval lengthens.
The stress record points the same way. Against the conventional 60/40's -28.6% through the COVID crash and -22.4% through the 2022 rate shock, the 58/42 compliant blend lost 20.4% and 18.6%. Directionally real, and consistent across two very different shocks.
So what: if you are building this product, the sales argument is not "sukuk is safe". It is "these two sleeves fit together better than the conventional pair". That argument survives scrutiny. The other one does not.
06. The price is thirty basis points a year, and all of it sits on the equity side.
| Weighted expense ratio | |
|---|---|
| Conventional 60/40 | 0.174% |
| Sharia-compliant blend | 0.470% |
| Difference | 29.6bp a year |
Compounded across the 6.71-year window that is roughly $196,000 on a $10m allocation.
The cost is not spread evenly, and it is not really about sukuk. The two bond sleeves are 11bp apart. The gap is almost entirely on the equity side, where the conventional tracker charges 3bp and the cheapest comparable Sharia-screened large-cap ETF charges 45bp.
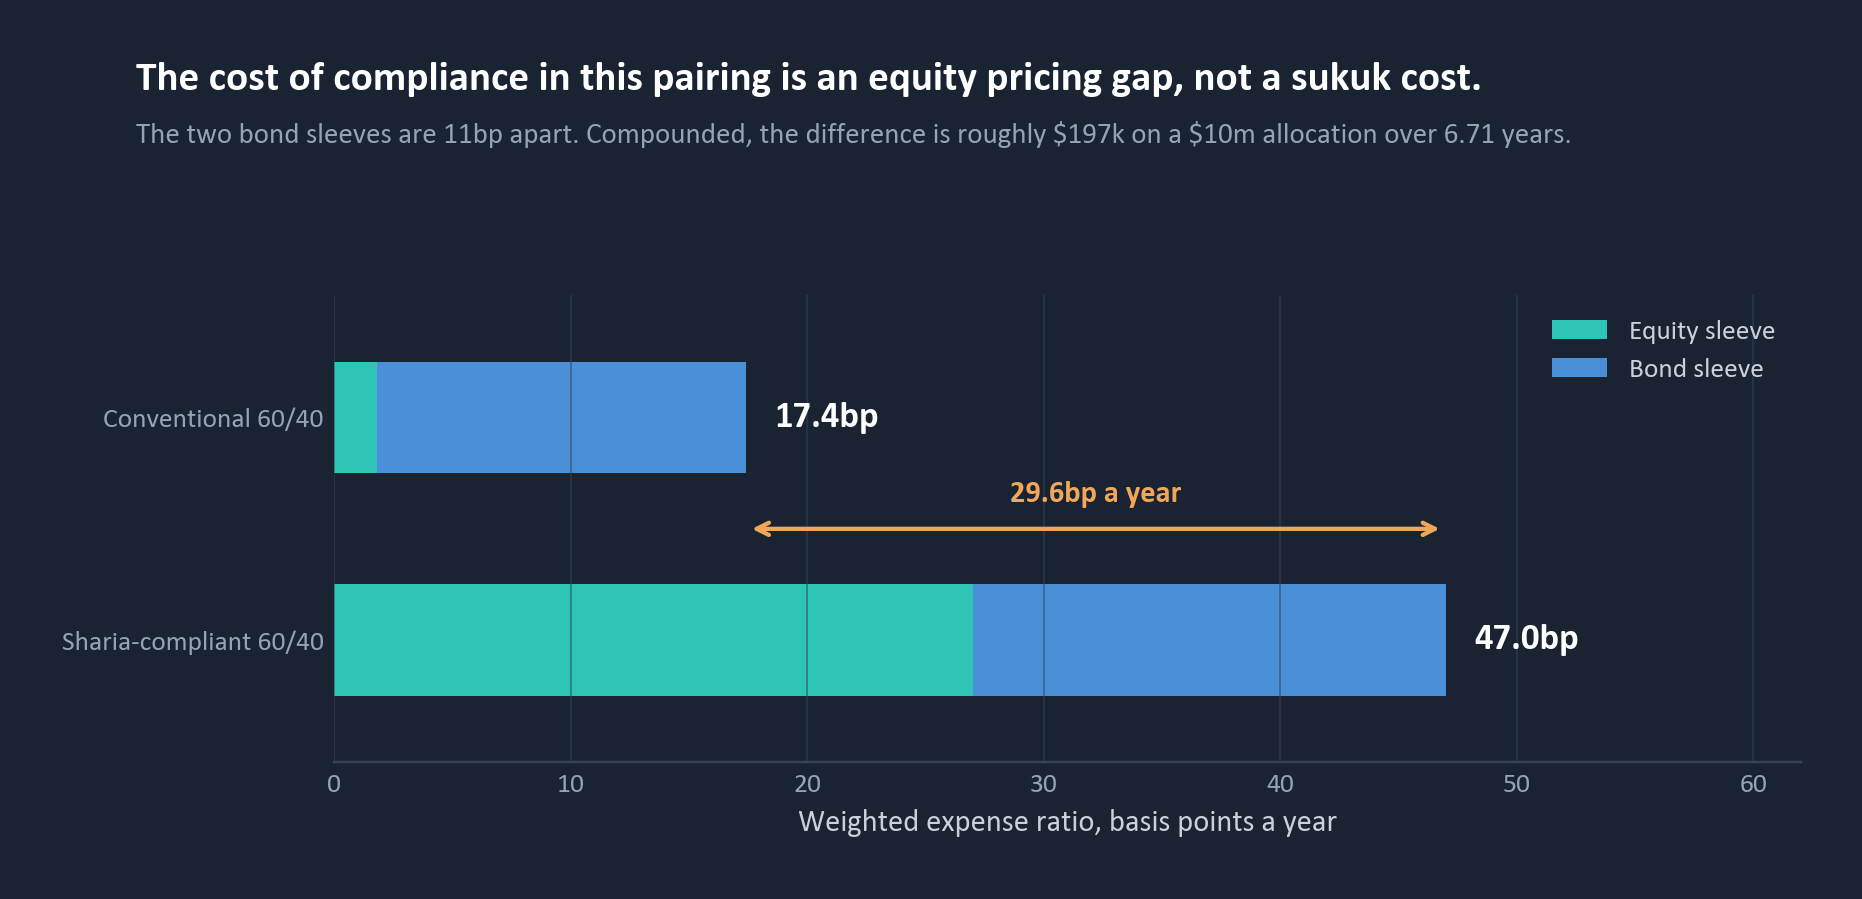
Figure 5. The cost of compliance in this pairing is an equity pricing gap, not a sukuk cost.
This is a scale problem rather than a complexity problem, and it is the clearest commercial opening in the whole analysis. A Sharia-screened large-cap equity ETF priced anywhere near the conventional tracker would close most of a 30bp gap on its own. Nothing in the construction of such a fund justifies a 42bp premium over an S&P 500 tracker at scale.
So what: the compliance premium in this pairing is an equity pricing gap, not a sukuk cost. Whoever closes it takes the category.
07. Four things to check before you build.
The country labels on sukuk are structurally unreliable. Sukuk are issued through special purpose vehicles, because that is how the asset-backing works. Any country field populated from the issuing entity therefore reports the SPV's legal home, not the sovereign that owes the money. This is not hypothetical. On the largest US-listed sukuk ETF's portfolio dated 28 February 2026, 104 of 169 holdings, 62% of the book, carried the country tag "Cayman Islands", and not one carried Saudi Arabia. On the next portfolio, dated 4 March 2026, zero carried Cayman and 56 carried Saudi Arabia. Nothing in the fund changed. The tagging convention did. Any country-exposure report on a sukuk sleeve that spans that date is measuring a data change, not a portfolio change, and any such report run before it was measuring the wrong thing entirely.
Analytics coverage is uneven across the shelf. Across 17 portfolio dates from 14 May to 17 September 2026, the largest US-listed sukuk ETF carries no yield, no duration, no credit quality and no spread in the fixed-income feed. Only average coupon is populated. Its Irish UCITS peer is complete across all 16 of its dates. If you are comparing two sukuk funds on risk, confirm that both have the metrics before concluding that one looks better than the other.
The shelf is smaller and more concentrated than the headline count suggests. Our coverage holds 65 Sharia-compliant strategies at fund level with $30.0bn between them, once a feeder structure holding 99.97% of its master is removed from the count.
| Strategies | Assets | Of which exchange-traded | |
|---|---|---|---|
| Equity | 38 | $23.75bn | 16 funds, $10.67bn |
| Sukuk and Islamic fixed income | 15 | $4.35bn | 4 funds, $1.58bn |
| Multi-asset | 12 | $1.93bn | none |
Thirteen of those fifteen carry a sukuk mandate, holding $4.14bn; the other two are Sharia-compliant fixed income of a different kind, a trade-finance fund and a liquidity fund. Four sukuk ETFs exist in our coverage and hold $1.58bn between them. For scale, a single conventional investment-grade corporate bond ETF holds $28bn.
Pricing is where the thinness shows. Twelve of the fifteen publish an expense ratio, and across those twelve it runs from 0.03% to 1.52% for what is broadly the same exposure. The four exchange-traded funds are tightly grouped at 0.40% to 0.50%; the dispersion sits in the fund wrappers, where the cheapest figure is an institutional class carrying no management fee inside the fund and the dearest is more than fifty times it. Measured at fund level rather than share class, the largest sukuk vehicle is a Luxembourg mutual fund at $1.10bn charging 1.50%; the two largest ETFs are level at $667m and $666m, charging 0.50% and 0.40%.
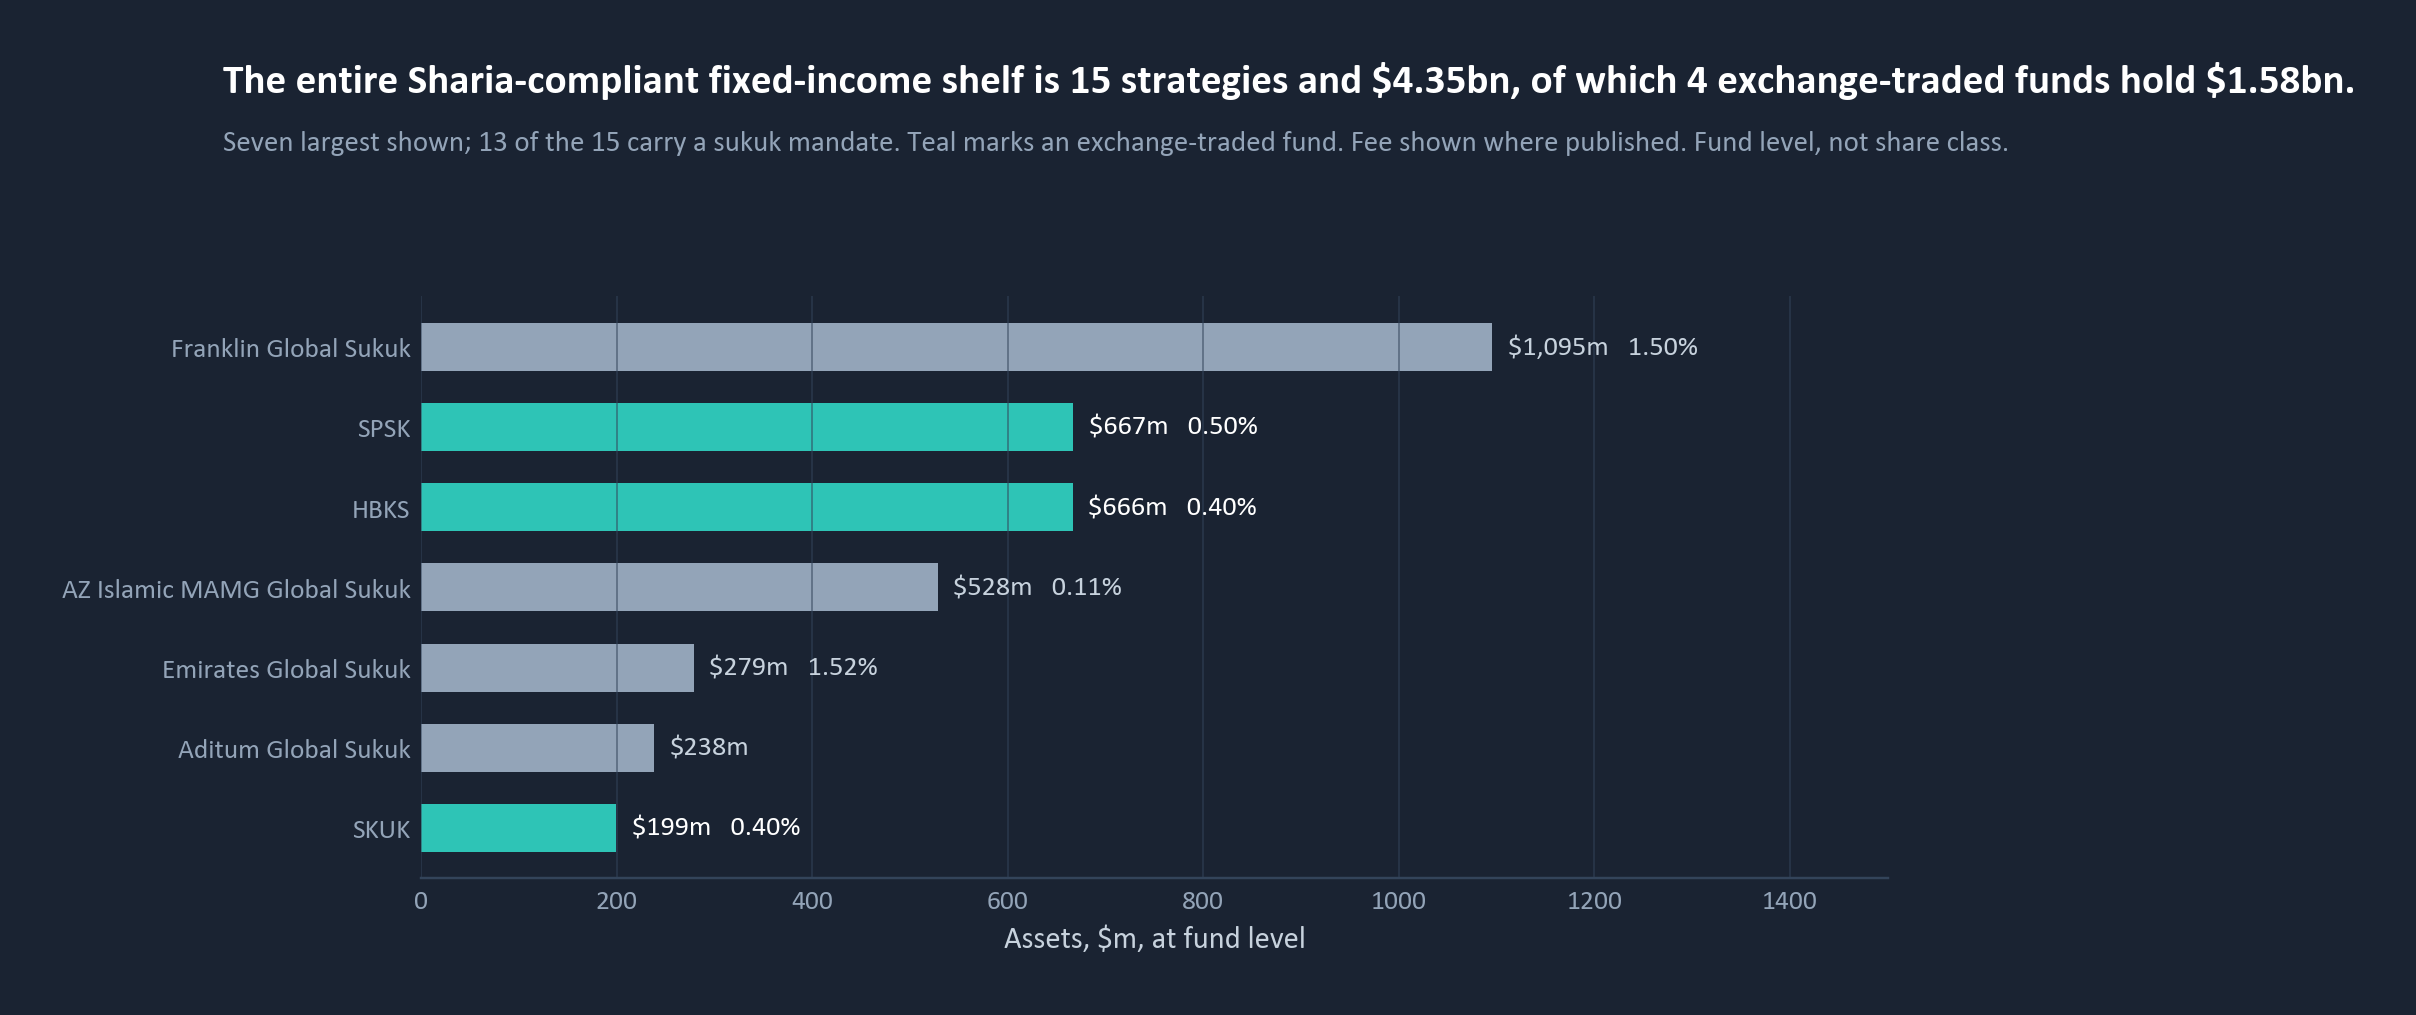
Figure 6. The entire Sharia-compliant fixed-income shelf is 15 strategies and $4.35bn, of which four exchange-traded funds hold $1.58bn.
Growth in this category is subscriptions, not performance. Twelve-month net flow as a share of assets, through 31 July 2026:
| Net flow ÷ assets | |
|---|---|
| Irish sukuk UCITS ETF | 48.6% |
| US sukuk ETF | 46.5% |
| Second Irish sukuk UCITS ETF | 25.1% |
| Conventional IG corporate ETF | 15.6% |
| Conventional S&P 500 tracker | 11.2% |
| Conventional EM sovereign ETF | 8.4% |
The sukuk vehicles gathered assets at three to six times the conventional rate while their net asset values were close to flat. Read carelessly, headline asset growth in this category looks like performance momentum. It is distribution reaching a buyer who was not previously served, which is a different signal and, for anyone considering a launch, a better one.
08. Methodology
Window. All return, volatility, correlation and drawdown figures use one matched window of 1,685 trading days, 27 December 2019 to 11 September 2026, bounded by the December 2019 inception of the two US-listed screened funds. Where the 2022 rate shock is cited it runs 1 January to 21 October 2022 throughout. The COVID episode runs 19 February to 23 March 2020.
Conventions. Returns are annualised from daily total-return series by compounding; volatility is the daily standard deviation scaled by the square root of 252. Sharpe ratios use a zero risk-free rate and are therefore not comparable to screener-published Sharpe figures, which net a trailing cash proxy. Maximum drawdown is the largest peak-to-trough decline in the cumulative total-return series. Correlations are Pearson on daily simple returns unless a longer interval is named.
Frequency tests. Weekly series are Friday-to-Friday closes; monthly series are calendar month-end closes, annualised by the square root of 52 and 12 respectively.
Blends. The target is a static 60/40 rebalanced daily by construction. Minimum-tracking-error, volatility-matched and return-matched weights are each solved in closed form against the target's daily return series. Tracking error is the annualised standard deviation of the difference series.
Fees. Current expense ratios applied across the full window; historical fee waivers are not reconstructed. Realised returns already embed each fund's own fee, so the weighted expense figures measure the forward difference between constructions rather than restating history.
What is assumed rather than measured. Transaction costs are assumed to be zero for every vehicle. We hold bid-offer data for the two conventional funds and not for the screened ones, so the compliant blend's real-world cost is understated by an amount we can bound only as positive. Given the size difference, $667m against $846bn on the equity side, the understatement is not trivial, and it runs against the compliant blend.
Coverage. The shelf figures are a name and category screen across our global fund and ETF database, resolved to fund level rather than share class, extraction 20 September 2026. They describe the vehicles in our coverage. Our coverage of this universe is entirely public-market: 38 equity strategies, 15 fixed income, 12 multi-asset.
Three Horizons Capital builds the data infrastructure behind investment decisions: portfolio analytics, portfolio construction, and the sales enablement that carries both to the client.
Data as at 20 September 2026. Fund analytics and holdings from our global fund and ETF database; daily total-return series through 11 September 2026. All figures derived once into a single frozen source read by every version of this paper.
This paper is for information only. It is not investment advice, not an offer or solicitation, and not a recommendation of any security. Funds are named to identify measured exposures, not to endorse them. Past performance does not indicate future results. Figures are historical and derived; the limitations stated in section 08 are part of the finding.
Important information
This paper is for information only. It is not investment advice, not an offer or solicitation, and not a recommendation of any security. Funds are named to identify measured exposures, not to endorse them. Past performance does not indicate future results. Figures are historical and derived; the limitations stated in section 08 are part of the finding.