Product design
To CFD or Not to CFD
The case for direct investment and ETFs over contracts for difference. For long-term capital growth, the CFD's own mechanics are the reason it is the wrong vehicle.
Three Horizons Capital, Research. September 2026. Regulator, legal and long-run market figures are from external sources and are not 3HC data; ETF cost figures in section 02 are from the 3HC fund database as at 30 September 2026.
70–89%
Of retail CFD accounts lose money over a trailing 12 months, per FCA and ESMA disclosures (external, not 3HC data)
$700 vs $25–$38
A year's financing on a $10,000 CFD at ~7%, against the median index equity ETF's annual charge on the same exposure (3HC fund data)
No rolling 20-year loss
In nominal terms, across the modern S&P 500 record, per widely cited long-run studies (external, not 3HC data)
The finding in one line
For long-term capital growth, direct shareholdings and listed ETFs remain the structurally sound default, and the CFD's own structure, not investor error alone, is a material part of why it fails as a substitute.
For long-term growth, a CFD's own mechanics make it the wrong vehicle
Contracts for Difference occupy a specific, defensible niche in retail markets: short-horizon, leveraged, directional trading. What they are not, despite marketing that frequently blurs the line, is a substitute for building long-term wealth through equity market exposure. This paper's premise is direct: for an investor whose objective is long-term capital growth rather than short-term tactical trading, a direct shareholding or a listed ETF is structurally the better vehicle, and the CFD's own mechanics are the reason why.
The case does not rest on CFDs being poorly designed or badly regulated. UK and EU regulators (FCA, ESMA) have built a genuinely robust retail-protection regime around them, covered in section 02. It rests on a narrower, harder-to-dispute point: CFDs and ETFs are not competing solutions to the same problem. A CFD is a cash-settled, leveraged bet on a price difference with no underlying ownership, a rolling overnight financing charge, and a counterparty (the broker) standing on the other side of every trade. An ETF or a direct share purchase is beneficial or legal ownership of the underlying asset, with no leverage unless self-imposed, no daily financing drag, and no reliance on a single counterparty's solvency for the position's continued existence.
Three structural facts frame the rest of this paper.
1. Regulatory loss disclosure is not incidental: it is the point. FCA and ESMA require every CFD broker to publish, per account, the percentage of retail clients who lost money over a trailing 12-month window. Across the two regimes the published range is roughly 70–89% (detail in section 03). No equivalent disclosure regime exists for ETF or direct-share investing, because the product does not carry the same structural loss profile.
2. The features marketed as CFD advantages are mechanically identical to their loss drivers. Leverage that lets a small account "punch above its size" is the same leverage that turns an adverse move into a margin call. Overnight financing that makes the product capital-efficient intraday is the same financing that compounds against any position held longer than a few weeks.
3. The vehicles are not tax- or cost-equivalent in the way retail marketing implies. Section 02 shows that the UK stamp-duty exemption often cited as a CFD advantage is also available on ETF units, not just CFDs. So it is an argument for ETFs over direct stock-picking, not an argument for CFDs over ETFs.
What this paper does not claim
That CFDs are unsuitable for every use case. A professional or well-capitalised trader executing a genuine short-horizon hedge or tactical view, sized and margined conservatively, is using the product as designed. The claim is narrower and, for a long-term allocator, more relevant: as a substitute for buy-and-hold equity exposure, the CFD's own cost and risk structure works against the holder, and the regulator-disclosed evidence bears this out.
A CFD's costs and risks are built into the product, not added to it
2.1 Fee and cost structure. External sources, not 3HC data.
| Cost element | CFD | ETF | Direct share purchase |
|---|---|---|---|
| Entry cost | Spread only (typically no commission) | Spread + broker commission (often zero-commission today) | Spread + broker commission |
| Ongoing cost | Overnight financing: benchmark rate (SOFR/SONIA/€STR/EURIBOR) + broker markup (commonly ~2.5–3% p.a.), charged daily on the full leveraged notional of the position | Expense ratio: average index-equity ETF ≈0.14% p.a. (2024); low-cost broad-market ETFs commonly 0.03–0.20% p.a. | None (beyond custody/platform fees) |
| UK stamp duty (SDRT) | Exempt: no underlying transfer occurs | Exempt for the investor under the Stamp Duty and SDRT (Exchange Traded Funds) (Exemption) Regulations 2014 (the ETF itself may still incur SDRT on underlying UK share purchases, priced into tracking difference) | 0.5% on UK-incorporated share purchases (several narrow exemptions apply, e.g. AIM shares, sub-£1,000 private trades) |
| UK tax on gains | Subject to Capital Gains Tax like any other asset (CFDs are not exempt the way spread bets are) | Subject to Capital Gains Tax (annual exempt amount applies); ISA/SIPP wrapper can shelter gains entirely | Subject to Capital Gains Tax; ISA/SIPP wrapper available |
The mechanical point worth isolating: a CFD's financing charge is an interest-bearing cost that compounds daily against the position, calculated on notional exposure, not capital committed. Illustratively, a $10,000 leveraged CFD position at a combined ~7% annual financing rate accrues roughly $58/month in carry cost alone. That cost scales with how long the position is held and is structurally absent from a direct or ETF holding, where the "cost" is a small, disclosed, asset-based expense ratio, not a daily interest charge on borrowed exposure. Held for a single day or a few weeks, this difference is immaterial. Held for a year or more, which is the horizon a long-term allocator cares about, it compounds specifically because the vehicle is levered, in a way an unlevered ETF or direct holding cannot replicate.
2.2 Leverage and drawdown mechanics. External sources, not 3HC data.
A CFD's capital efficiency is the same mechanism that converts an ordinary market drawdown into a margin call or forced liquidation. Under FCA/ESMA retail leverage caps, margin runs at approximately 3.3%–50% of notional, a leverage range of 30:1 down to 2:1 varying by asset-class volatility: major indices typically require around 3.3%–5% margin, individual equities commonly 5%–20%, and more volatile or illiquid assets up to 50%.
An ETF or direct shareholding bought outright cannot be "closed out" by a margin call. The worst case is the security's own price decline, borne in full but never amplified by embedded leverage, and never forcing a sale at the investor's most inopportune moment. This is not a subtle distinction: it is the structural reason a CFD's loss profile and an ETF's loss profile diverge so sharply over any holding period longer than a short-term trade (quantified in section 03).
2.3 Counterparty risk and asset ownership. External sources, not 3HC data.
This is the least discussed and most consequential structural difference.
A CFD is an unsecured OTC contract with the broker as direct counterparty. The client has no claim on any underlying security, only a contractual right to the price difference, enforceable against the broker. FCA rules (CASS 7) require brokers to segregate client money (cash, including margin) in trust accounts, separate from the firm's own funds, with daily reconciliation and mandatory Client Money Asset Return filings. Retail clients also receive mandatory negative balance protection (in force since August 2019, following ESMA's EU-wide intervention): a client cannot lose more than the funds in their account, and the broker must absorb any deficit. These are genuine, binding protections, and they materially reduce the tail risk of CFD trading relative to unregulated venues.
However, segregation protects the client's cash: it does not make the client an owner of any asset. In an ETF or a directly held share, the investor's holding is a security registered in their name or held in custody on their behalf, a proprietary claim on an actual asset, not a contractual claim on a broker's derivative book. If a CFD broker fails, the client's cash should be returned via the trust arrangement (subject to standard FSCS compensation limits, currently £85,000, if the segregation itself proves deficient), but the CFD position itself terminates with the broker. There is no underlying asset to transfer to a new custodian. An ETF holding transfers cleanly to a new broker or custodian regardless of what happens to the original broker, because the client already owned the units.
Net assessment
The regulatory regime around UK/EU CFDs is genuinely protective relative to how the product is sometimes characterised, but it protects against catastrophic tail outcomes (unlimited debt, commingled funds), not against the everyday mechanics of leverage, financing drag, and the absence of underlying ownership that make the product a poor substitute for long-term equity exposure.
2.4 What a year of holding costs: the ETF side. From 3HC data.
The paper's cost case rests on one comparison: daily financing on a levered position against a small annual charge on an owned one. We measured the ETF side directly from the 3HC fund database: every index equity ETF in two domicile groups, one row per fund, priced at the share class or listing that holds the most assets, as at 30 September 2026.
| Index equity ETFs, 3HC fund database | Funds | Median annual charge | Middle half of funds | Funds charging 0.20% or less |
|---|---|---|---|---|
| US-domiciled | 976 | 0.38% | 0.20–0.57% | 28.1% |
| UCITS, domiciled in Ireland or Luxembourg | 879 | 0.25% | 0.15–0.40% | 46.5% |
Fund-count statistics. Not asset-weighted, because reported assets are missing for several of the largest ETFs in the database.
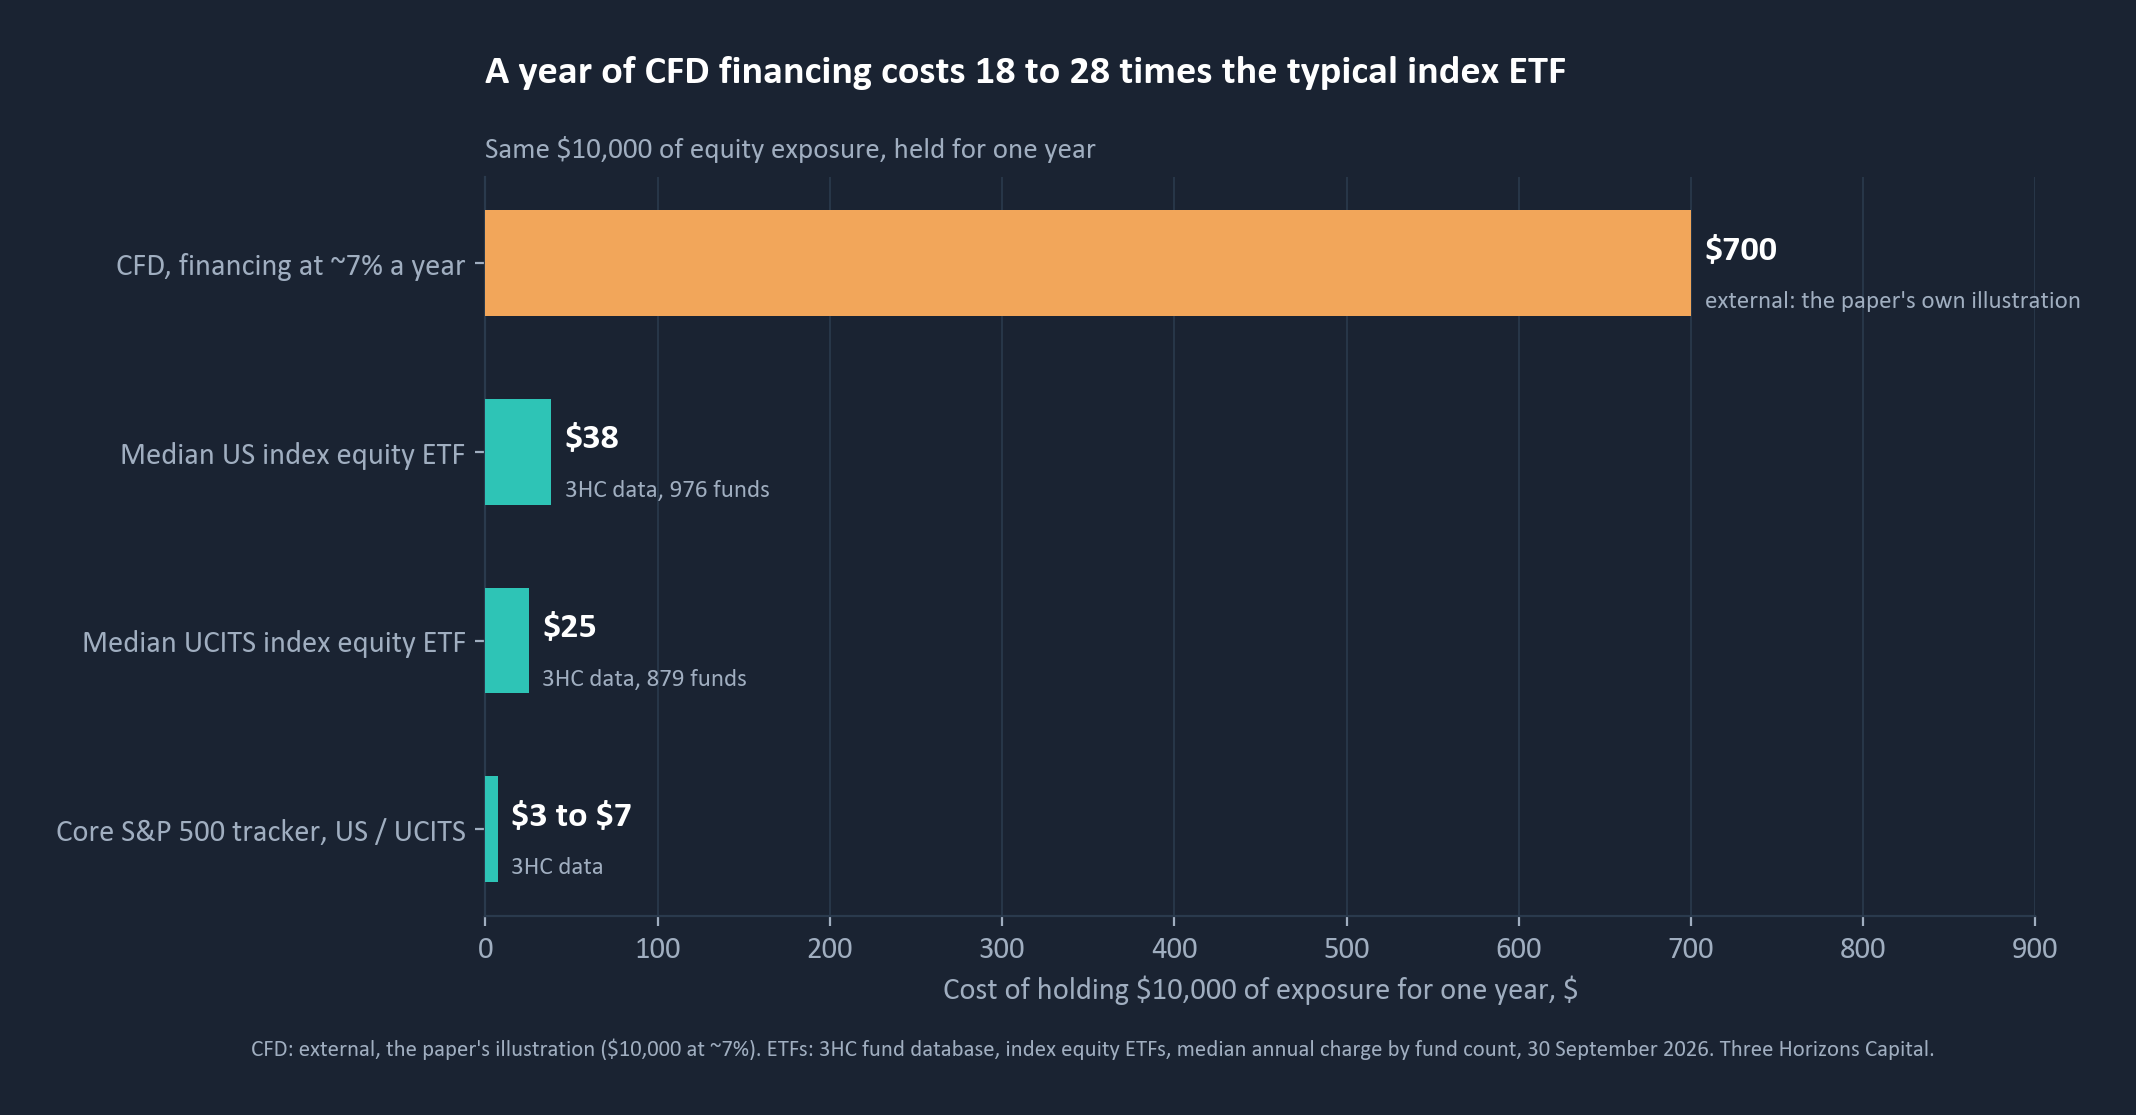
On $10,000 of exposure held for a year, the CFD financing in the paper's own illustration (~7% a year, roughly $58 a month) comes to about $700. The median index equity ETF charges $38 (US-domiciled) or $25 (UCITS) on the same exposure, and a core S&P 500 tracker in our data charges 0.03% (US) or 0.07% (UCITS), $3 to $7. A year's financing on the CFD is therefore about 18 to 28 times the annual charge of the typical index equity ETF, and roughly a hundred times or more that of a core tracker. That is the "many times over" of section 04, measured.
Regulators publish the outcome: most retail CFD accounts lose money
3.1 The regulator-disclosed CFD outcome. External, not 3HC data.
FCA and ESMA mandate quarterly, per-broker disclosure of the percentage of retail clients who lost money over the trailing 12 months, a genuine, audited data point, not a survey estimate:
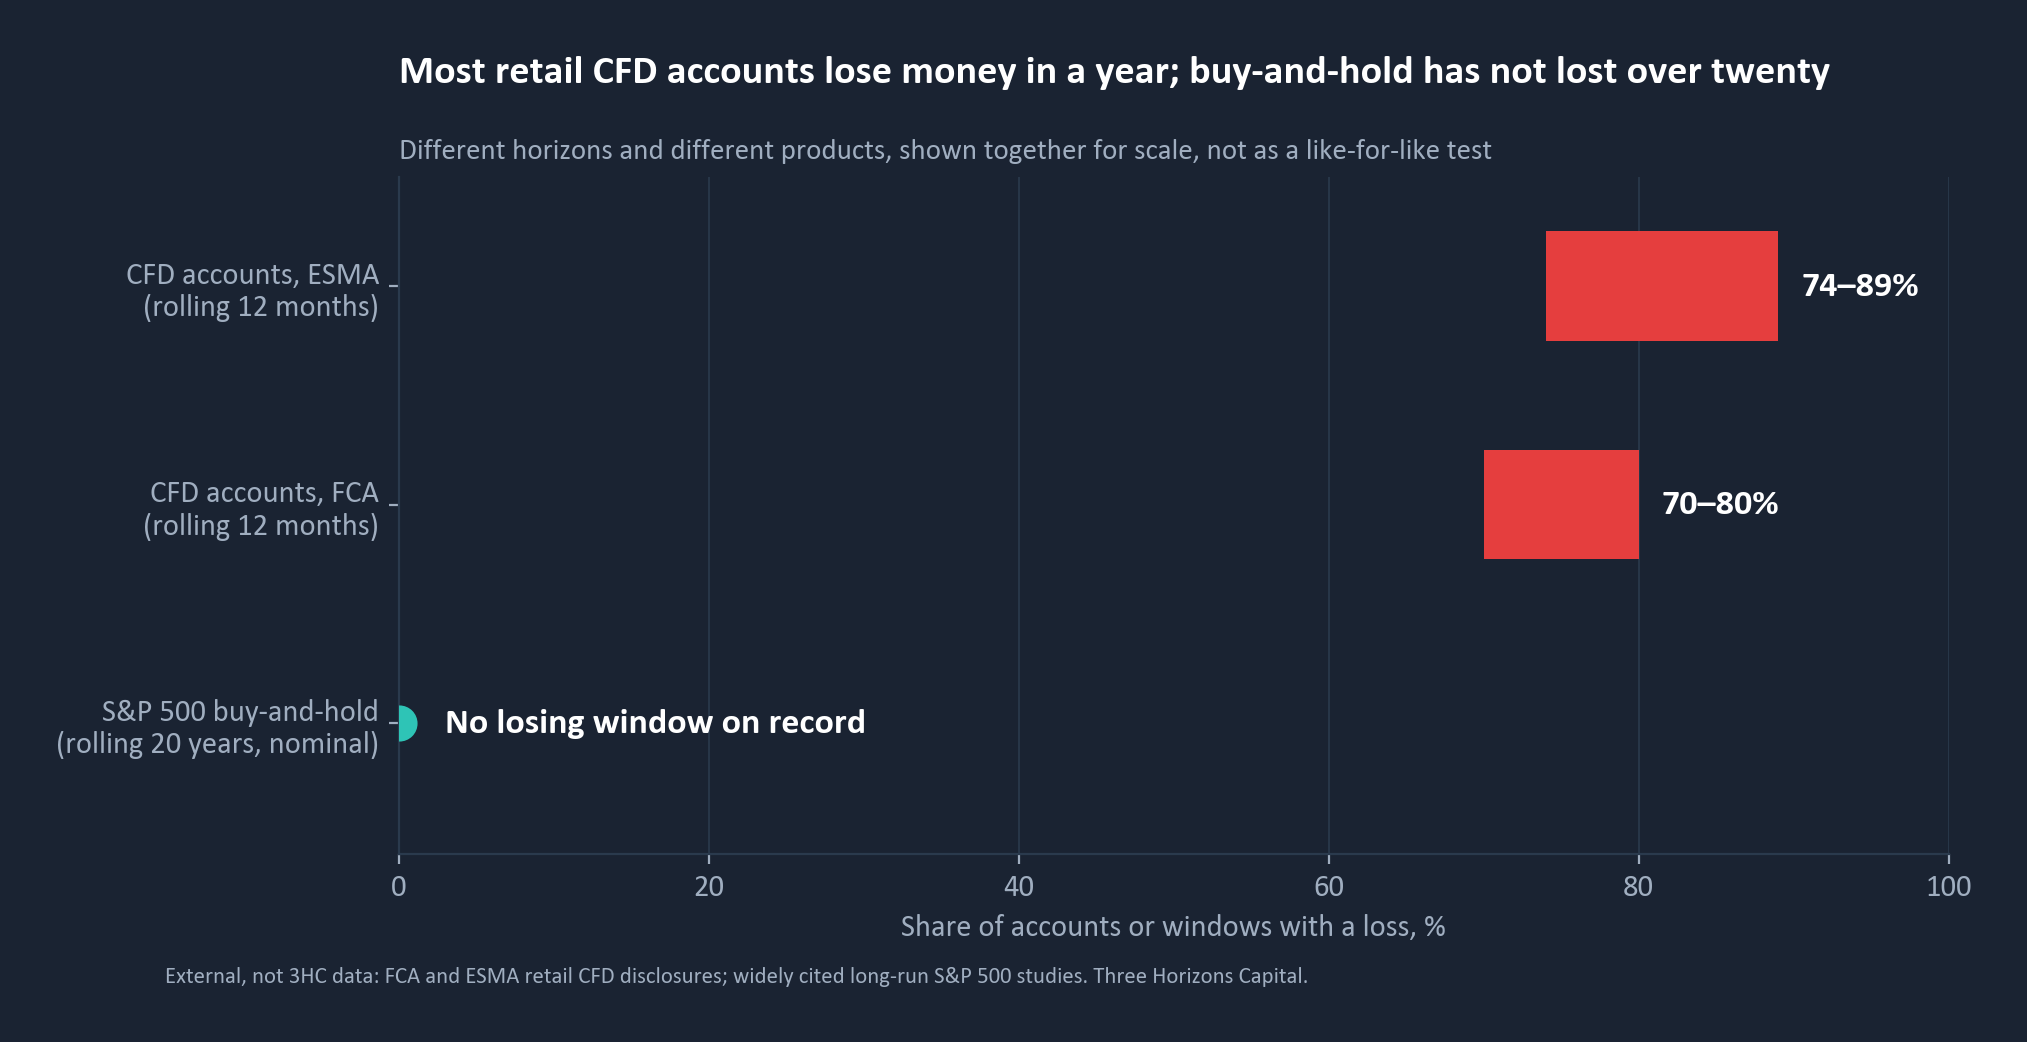
FCA: roughly 70–80% of retail CFD accounts lose money over a 12-month window. An April 2026 aggregation across 14 FCA-authorised brokers showed a mean of 69.9%.
ESMA (EU-wide): 74–89% of retail CFD accounts lose money.
This is a structural, product-level outcome, not an artefact of bad luck in a single bad year. The disclosure regime exists across market cycles precisely because the loss rate persists through both up and down markets, driven by leverage and financing cost rather than by broad market direction.
3.2 The long-term buy-and-hold comparator. External, not 3HC data.
There is no equivalent mandatory "% of accounts that lost money" disclosure for direct/ETF investing, because regulators do not treat it as a comparable-risk product category. The closest available published evidence:
DALBAR's Quantitative Analysis of Investor Behavior (QAIB) measures the shortfall of the average fund investor against the benchmark they were nominally invested in, driven mainly by mistimed entries and exits, not product structure. In 2024 the average equity-fund investor returned 16.54% against the S&P 500's 25.02%; in 2025, 17.16% against 17.88%. In neither year did the average investor register a negative return, a fundamentally different outcome category from the CFD disclosure above.
Rolling holding-period loss probability. Widely cited long-run studies of the S&P 500 (data back to 1926, and reconstructed composites to 1871) find that no rolling 20-year nominal holding period has ever produced a negative return, including periods spanning the Great Depression and WWII (the weakest 20-year window, ending 1949, still produced a small positive nominal gain). Real (inflation-adjusted) 20-year returns have occasionally been negative in high-inflation windows, notably some periods touching the 1970s, but even the weakest real-return windows have not approached the ~70–90% negative-outcome rate the CFD disclosure regime reports over just a 12-month window.
These long-run figures are cited from published research, not reconstructed from 3HC's own equity database.
3.3 What the comparison shows, net.
| CFD (regulator-disclosed) | Direct / ETF buy-and-hold (published third-party research) | |
|---|---|---|
| Measurement basis | Mandatory quarterly broker disclosure | DALBAR QAIB (behavioural shortfall) + long-run rolling-return studies |
| Horizon measured | Rolling 12 months | Multi-year to 20-year rolling windows |
| Headline outcome | ~70–89% of accounts show a net loss | Average investor still positive in both 2024 and 2025 (DALBAR); no rolling 20-year nominal loss in the modern S&P 500 record |
| Driver of the gap | Leverage + daily financing cost + no underlying ownership (section 02) | Behavioural mistiming causes shortfall vs. benchmark, but the underlying unlevered asset class itself has not historically produced rolling 20-year nominal losses |
External sources, not 3HC data.
Use CFDs for short, sized trades, and default to shares and ETFs for wealth
Bringing sections 01 to 03 together: the appeal of CFDs (capital efficiency, symmetric short access, one-account market breadth, and simple execution) is genuine and not a marketing fiction. But every one of those features is mechanically inseparable from the product's loss drivers. Leverage that amplifies a small account also amplifies a drawdown into a margin call. Daily financing that makes the product cheap to hold for an afternoon makes it expensive to hold for a year. The regulator-mandated loss disclosures (FCA roughly 70–80%, ESMA 74–89% of retail accounts losing money on a trailing 12-month basis) are not evidence of retail investors making avoidable mistakes with an otherwise sound product. They are evidence of a product whose own structure works against a buy-and-hold objective. By contrast, an ETF or direct shareholding carries no embedded leverage, no daily financing drag, and represents actual ownership of an asset that survives the failure of any single broker.
None of this makes CFDs illegitimate. It makes them a different tool for a different job: short-horizon, leveraged, tactical or hedging use by an investor who understands margin mechanics and is prepared to monitor the position actively. It does not make them a substitute for long-term wealth accumulation, and the regulator-disclosed evidence is unambiguous on that narrower point.
4.1 Recommendations by investor objective.
For a long-term allocator building or maintaining core equity exposure
Default to direct shareholdings or listed ETFs for any position intended to be held longer than a few weeks. The absence of daily financing drag and embedded leverage removes the two largest structural headwinds a CFD holder faces over a multi-month or multi-year horizon.
Use tax-advantaged wrappers where available (UK ISA/SIPP, or the local equivalent). Both direct shares and ETFs qualify; CFDs generally do not benefit from the same shelter and remain subject to Capital Gains Tax with no offsetting advantage over a wrapped ETF position.
Treat the UK stamp-duty exemption on CFDs as a non-differentiator. ETF units carry the same exemption under the 2014 SDRT regulations, so it is not a reason to prefer the leveraged product.
For a genuine short-horizon tactical or hedging need
CFDs remain a defensible tool when the position is sized conservatively relative to account equity, the holding period is measured in days or weeks rather than months, and the financing cost has been explicitly budgeted into the expected return of the trade.
Rely on the regulatory protections that do exist. FCA CASS 7 client-money segregation and mandatory negative-balance protection materially cap tail risk relative to unregulated venues, but do not mistake these for protection against the ordinary mechanics of leverage and financing drag.
Pre-commit to a maximum holding period or a stop-loss discipline before opening the position, given that the product's cost structure penalises indecision or drift into a longer, unplanned hold.
For anyone evaluating a CFD pitched as a long-term investment substitute
Ask what the trailing-12-month loss rate is for the specific broker. It is a mandatory FCA/ESMA disclosure and should be quoted on request. A rate materially above the 69.9% FCA mean is a signal to look elsewhere, and a rate materially below it merits scrutiny of the disclosure's scope.
Model the financing cost over the intended holding period, not just the spread. A position held for a year at typical retail financing rates can accrue a carry cost that dwarfs an ETF's annual expense ratio many times over; on our fund data, about 18 to 28 times the median index equity ETF.
Default to "no" absent a specific, time-bounded tactical rationale. The regulator-disclosed evidence in section 03 is the single clearest data point available on this question, and it does not support using a CFD as a long-term buy-and-hold vehicle.
4.2 Bottom line.
To CFD, or not to CFD: the honest answer depends entirely on what the account is being used for. As a tactical, short-horizon instrument for an investor who understands margin, financing drag, and position sizing, the product does what it says on the tin. As a substitute for traditional long-term investing, the regulator-disclosed evidence is that it overwhelmingly does not work for the account holder, and the product's own structure, not investor error alone, is a material part of why. For the long-term capital-growth objective this paper addresses, direct shareholdings and listed ETFs remain the structurally sound default.
Where the numbers come from
3HC data. Section 2.4 only: index equity ETF annual charges from the 3HC fund database, latest snapshot as at 30 September 2026. 976 US-domiciled and 879 UCITS funds (Ireland, Luxembourg), one row per fund, priced at the share class or listing holding the most assets; medians and interquartile ranges by fund count. Not asset-weighted, because reported assets are missing for several of the largest ETFs.
External sources, not 3HC data. Everything else: FCA and ESMA retail CFD loss-rate disclosures; DALBAR Quantitative Analysis of Investor Behavior (QAIB) 2024–2025 reports; FCA CASS 7 client-money and negative-balance-protection rules; UK SDRT ETF exemption regulations (2014); CFD overnight financing mechanics and ETF expense-ratio averages; long-run S&P 500 rolling holding-period return history. Cross-source figures use different denominators, time windows and loss definitions and do not reconcile to a single number.
This paper is for information only. Prepared by Three Horizons Capital, it is research, not investment advice, and no security, fund or product is recommended. Figures are as at the dates stated.
If this is useful
We build this kind of test for managers and platforms deciding what to put in front of long-term investors, and how to explain it. If the question in front of you is whether a product's structure works for or against the people who hold it, that is the work we do.
Important information
This paper is for information only. Prepared by Three Horizons Capital, it is research, not investment advice, and no security, fund or product is recommended. Figures are as at the dates stated.