Portfolio construction
The Hedge Was Built for a Different Shock
In March 2026 geopolitical risk reached its highest level since March 2003. Portfolio teams are being asked where it belongs: in the strategic allocation, in tactical positioning, or both, and whether the playbook history teaches still fits. We tested the question against thirty-six years of the risk itself and of what markets did with it.
Three Horizons Capital · 14 September 2026 · Geopolitical risk measured by a news-based academic index, monthly from January 1985 to August 2026. Market data daily into September 2026, in US dollars. Fund flows are US-listed exchange-traded funds, weekly. Written for investment professionals. No fund, provider, ticker or manager is named anywhere in this note.
6th
highest month for geopolitical risk since 1985 was March 2026, above the invasion of Ukraine
-11.1%
gold in the month after the strikes on Iran began, alongside -4.2% on long-dated Treasuries and -4.9% on US equities
3 of 3
geopolitical shocks since 1990 that ran through oil in which Treasury yields rose instead of falling
The finding in one line
Geopolitical risk belongs in the strategic portfolio, as a stress scenario defined by how the shock travels. The traditional hedge works when a shock hits growth and fails when it runs through oil, and since 2022 markets have behaved as though the second kind is the norm.
In the month after the strikes on Iran began, every conventional hedge fell with equities
Start with what happened, because it is the reason the question is being asked. We publish six months on deliberately: the next round of long-term capital market assumptions arrives around the turn of the year, and on this evidence that is where the answer belongs.
The strikes on Iran began on 28 February 2026. During March, shipping through the Strait of Hormuz was restricted and US crude oil rose from $67 to $103 a barrel. The geopolitical risk index we track recorded its highest daily reading of the episode, 500.8, on 2 March. Its reading for March as a whole, 330.2, is the sixth highest of the 500 months since January 1985. Collapse each crisis to its single worst month and March 2026 ranks fourth, behind September 11, the Gulf War and the invasion of Iraq, and ahead of the invasion of Ukraine at 319.0.
Here is what markets did from the last close before the strikes, 27 February, to the end of March.
| Market | Return or change |
|---|---|
| Crude oil | +53.6% |
| US dollar, trade-weighted | +2.7% |
| Short-dated Treasuries | -0.5% |
| Intermediate Treasuries | -2.3% |
| Long-dated Treasuries | -4.2% |
| US equities | -4.9% |
| Gold | -11.1% |
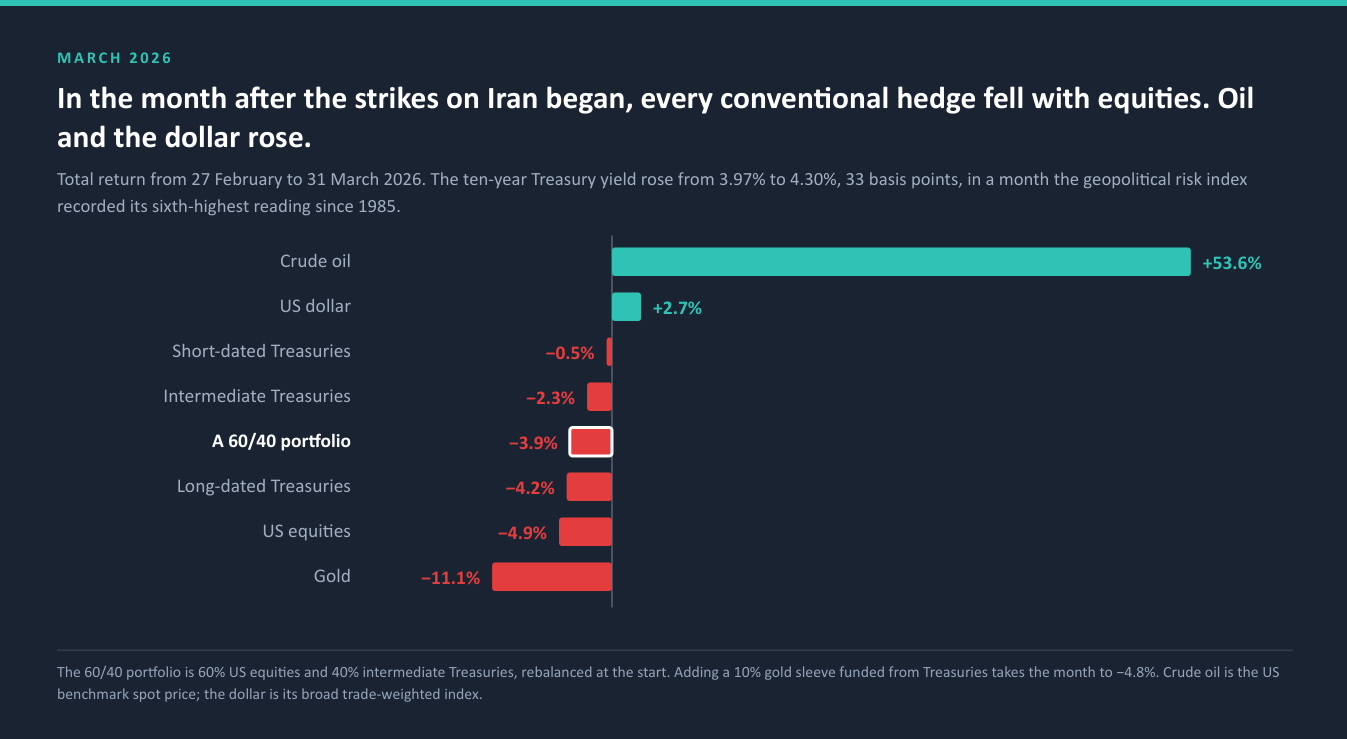
The hedges moved with the risk, not against it. The ten-year Treasury yield rose 33 basis points, from 3.97% to 4.30%, in a month when a flight to safety should have pushed it down. Across the trading days of March, daily returns on intermediate Treasuries moved with equities at a correlation of +0.55, and gold at +0.44. A 60/40 portfolio of US equities and intermediate Treasuries lost 3.9%. Funding a 10% gold sleeve from the Treasuries made the month worse, at -4.8%.
What rose was what the shock ran through. Oil, and the dollar.
The equity loss was brief. US equities reached their low, 7.6% below the last close before the strikes, on 30 March, and were back above that close on 13 April, ten trading days later. By the end of August they were 12.4% higher, while gold was 15.6% lower.
WHAT THIS MEANS FOR A PORTFOLIO TEAM
The instruments most portfolios hold as insurance against exactly this kind of event lost money during it, while the equity loss they were meant to cushion reversed within a fortnight. A client who asks why the hedge failed deserves a better answer than bad luck. The rest of this note is that answer.
Allocators bought government bonds as they fell, and sold gold
The flows show what professional money reached for.
Over the five weekly readings dated 2 to 30 March 2026, US-listed exchange-traded funds recorded:
| Category | Funds | Net flow, five weeks | 2025 pace, five weeks |
|---|---|---|---|
| Government bonds | 305 | +$13.3bn | +$8.7bn |
| Gold and precious metals | 47 | -$10.7bn | +$4.8bn |
| Energy equities | 134 | +$2.4bn | -$0.2bn |
| Energy commodities | 49 | +$2.4bn | +$0.2bn |
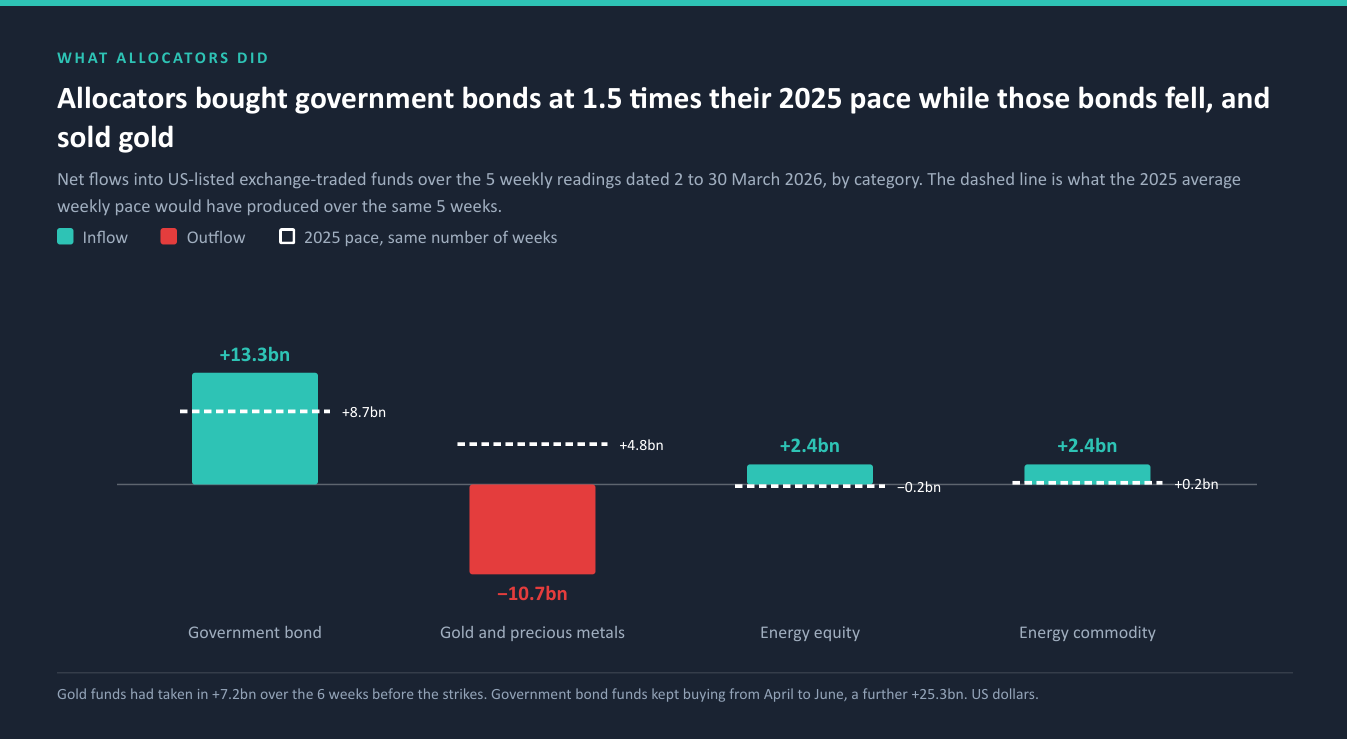
Government bond funds took in money at 1.5 times their 2025 pace while their prices fell. The buying continued, a further $25.3bn from April to June. That is the traditional reflex working exactly as designed, into an instrument that was losing value.
Gold funds lost $10.7bn in five weeks, after taking in $7.2bn over the six weeks before the strikes. Gold had risen 171.2% between February 2022 and February 2026. In the shock it was sold, not bought. A flow records what was done, not why.
Energy funds took in money in both wrappers, from a low base in 2025.
A CAUTION WE WOULD RATHER STATE THAN BURY
These are category flows for US-listed exchange-traded funds. They cover one wrapper in one market; mutual funds, separate accounts and futures sit outside them. They describe what allocators did in that wrapper, and they are the fastest-moving money in it.
Thirteen episodes since 1990 show that the channel decides whether the hedge works
One month is an anecdote, so we went back through the whole record.
We define an episode as a month in which the index stood at least two standard deviations above its own average over the previous five years, with spike months that fall within two months of each other counted as one episode. That rule finds 13 episodes between January 1990 and August 2026, one every 2.8 years. For each, we measured markets over the month in which the episode began.
| Episode | Began | US equities | Ten-year yield | Long Treasuries | Gold | Oil |
|---|---|---|---|---|---|---|
| Gulf War | Aug 1990 | n/a | +50bp | n/a | n/a | +33.4% |
| September 11 | Sep 2001 | -8.2% | -25bp | n/a | n/a | -12.0% |
| Iraq invasion | Mar 2003 | +0.2% | +12bp | -1.4% | n/a | -15.3% |
| Libya | Mar 2011 | 0.0% | +5bp | 0.0% | +1.6% | +9.4% |
| Crimea | Mar 2014 | +0.8% | +7bp | +0.7% | -3.1% | -1.3% |
| Ukraine and Gaza | Jul 2014 | -1.3% | +5bp | +0.7% | -3.6% | -7.4% |
| Paris attacks | Nov 2015 | +0.4% | +5bp | -0.9% | -6.8% | -13.2% |
| North Korea | Aug 2017 | +0.3% | -18bp | +3.2% | +4.2% | -5.9% |
| US strike in Iraq | Jan 2020 | 0.0% | -41bp | +7.7% | +4.5% | -15.6% |
| Russia and Ukraine | Jan 2022 | -5.3% | +27bp | -3.9% | -1.7% | +18.4% |
| Attack on Israel | Oct 2023 | -2.2% | +29bp | -5.5% | +7.4% | -10.1% |
| Israel and Iran | Jun 2025 | +5.1% | -17bp | +2.7% | +0.4% | +7.9% |
| Strikes on Iran, Hormuz | Mar 2026 | -4.9% | +33bp | -4.2% | -11.1% | +53.6% |
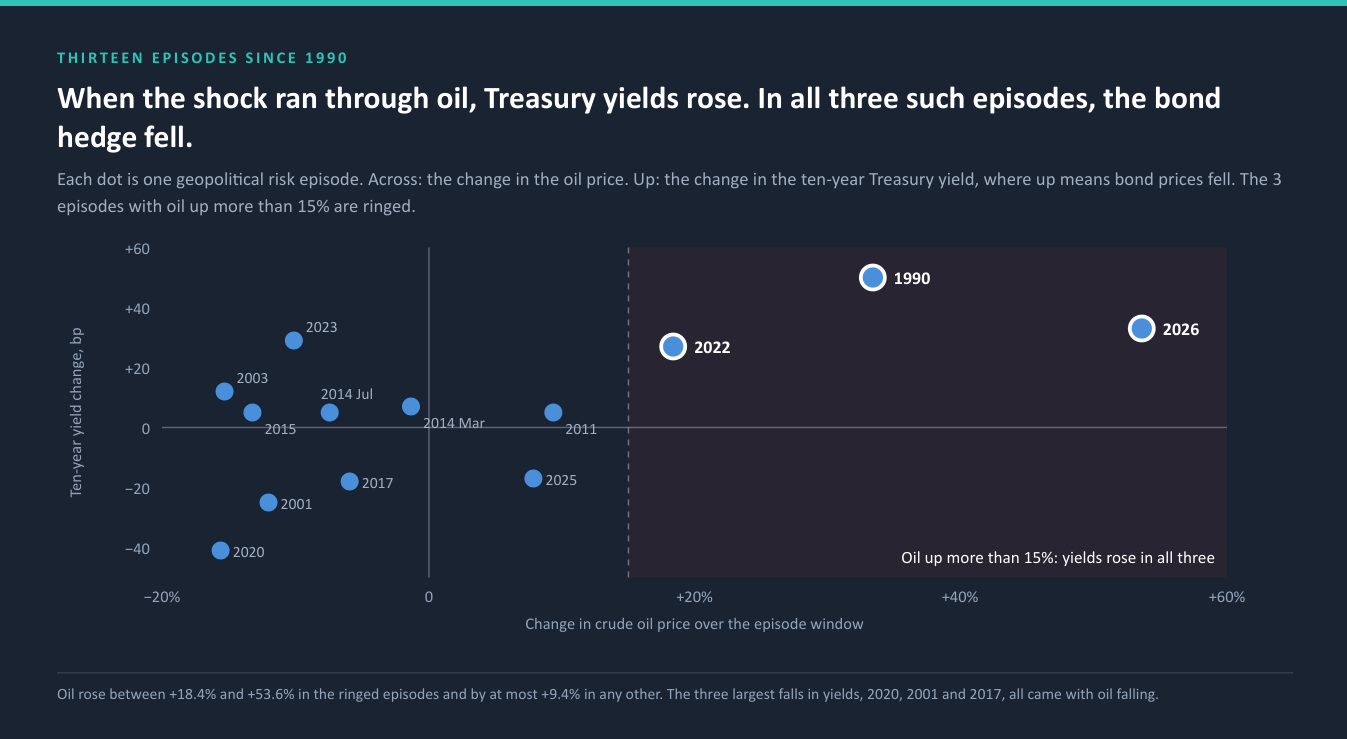
Split the episodes by what happened to oil and the pattern is plain. Three carried an oil shock: the Gulf War in 1990, Russia and Ukraine in 2022, and March 2026. Oil rose between 18.4% and 53.6% in those windows, and by at most 9.4% in any other. In all three, the ten-year Treasury yield rose, by between 27 and 50 basis points. Where we hold the data, long-dated Treasuries lost 3.9% and 4.2%, gold lost 1.7% and 11.1%, and equities lost 5.3% and 4.9%.
The other ten episodes rarely gave the hedge work to do. The median equity move in the month was +0.1%, and equities fell by more than 2% in two of the ten, September 11 and the attack on Israel in 2023. Yields fell in four of the ten. The three largest falls, 41 basis points in January 2020, 25 in September 2001 and 18 in August 2017, all came with oil falling. Gold rose in five of the eight episodes for which we hold its price.
The shocks that hurt equities were the shocks that hurt bonds. After September 11, the two largest equity losses in the record both came with an oil shock, and in both the bond sleeve fell alongside. The traditional hedge has a good record in the geopolitical episodes that mattered least, and a poor one in those that mattered most.
WHY OIL IS THE DIVIDING LINE
A shock that threatens growth sends investors toward safety and pulls rate expectations down, which is the environment in which Treasuries rally. A shock that raises the price of energy raises inflation at the same time and pushes rate expectations up. The same kind of event can do either. What decides the hedge is the channel, not the headline.
Three energy episodes are a small sample and we do not present them as a law. They are consistent with that mechanism, and with the evidence in the next section, which rests on far more data.
Both relationships the traditional hedge relies on changed in 2022
The third part of the question is whether history still fits. The playbook of buying duration and gold when geopolitical risk rises rests on two relationships. We measured both.
The first is between equities and bonds, and its change is well documented. We measured it on the same data because its size matters for what follows. From August 2002 to December 2021, the correlation of monthly returns between US equities and intermediate Treasuries was -0.31. From January 2022 to August 2026 it was +0.55. Measured over rolling three-year windows, it peaked at +0.67 after 2022 and stood at +0.44 at the end of August.
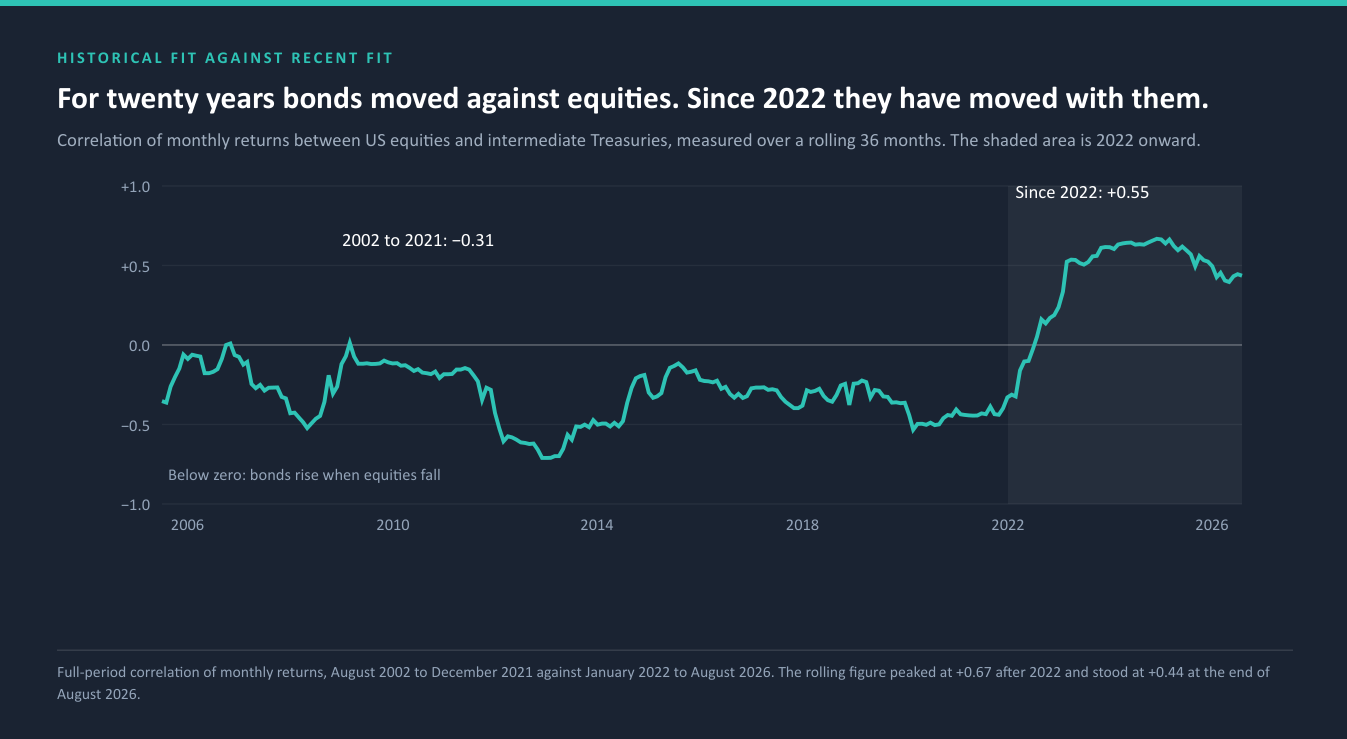
A negative correlation is what makes a bond sleeve insurance. A positive one makes it a second holding of the same risk. For two decades a balanced portfolio could take that insurance for granted. For the last four and a half years it could not, and March 2026 was that change arriving in a geopolitical shock.
The second is between gold and real yields. Since the end of 2021 the ten-year real Treasury yield has risen from -1.04% to 2.44%, 3.5 percentage points, and gold has risen 138.9%. That fact needs no model. For scale, from 2005 to 2021 the real yield explained 73% of the variation in the level of gold, and each percentage point rise came with gold roughly 27% lower. On that relationship gold's implied level fell 67%, and at the end of August gold traded at 6.5 times it. A single-factor relationship describes an asset with several drivers, so read the multiple as a measure of distance from the old anchor, not as a valuation.
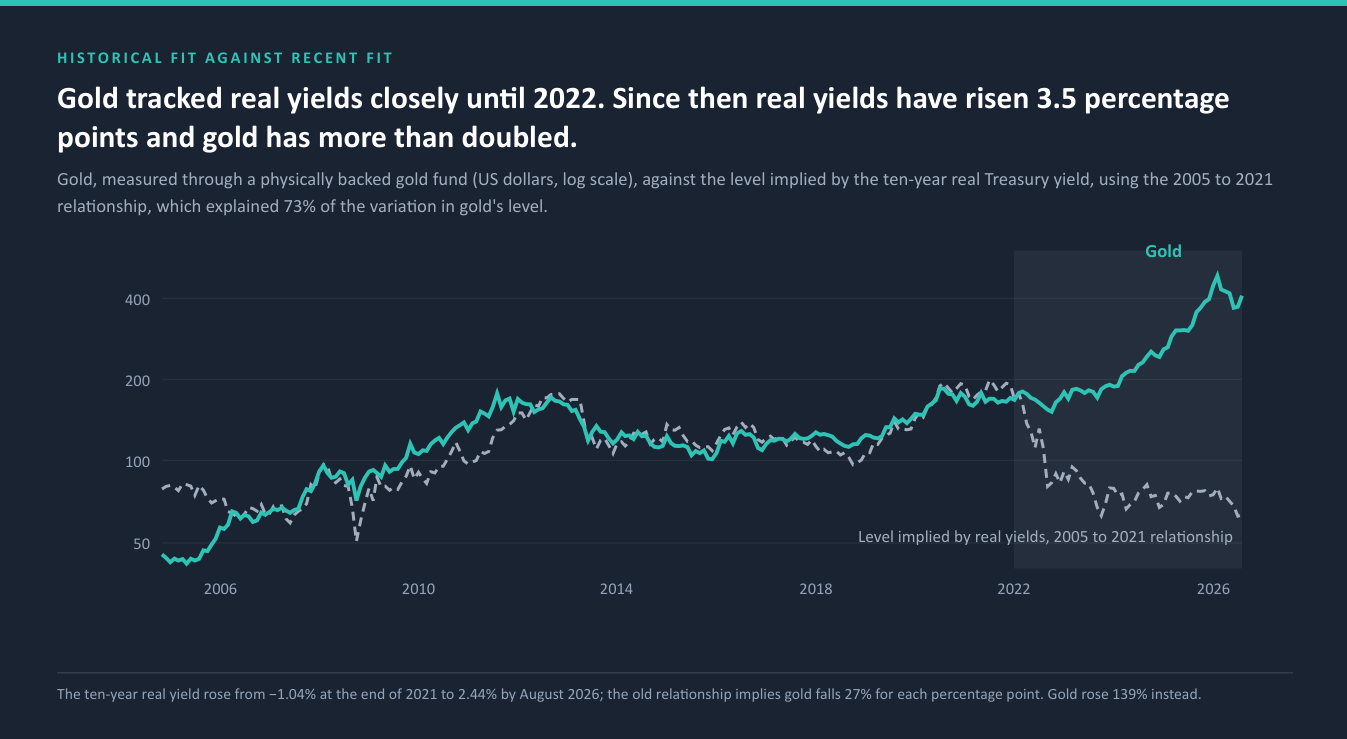
Gold still responds to real yields month to month, but its level has come loose. The correlation between monthly gold returns and changes in the real yield was -0.50 before 2022 and -0.41 since. The sensitivity survived; the anchor for the level moved.
The move in the anchor is consistent with a change in who buys gold. Across the same period, central banks and other official holders have been widely reported as sustained buyers, adding gold to reserves for diversification rather than on a view of real yields. A large buyer that does not price gold off real yields changes what sets its level. Official-sector purchases sit outside the data behind this note, so we offer this as the explanation most consistent with what we measured, not as a finding of our own.
Gold entered March 2026 after a 171.2% rise in four years, and in the shock it was sold.
HISTORICAL FIT AGAINST RECENT FIT
The historical playbook was fitted to a world in which bonds hedged equities and gold was priced off real yields. Both conditions changed in 2022. The playbook still works in a shock that hits growth and leaves inflation alone. It is the wrong default for a shock that runs through energy.
Tactically, there are too few episodes to time, and the equity loss usually passes within weeks
Timing a risk requires repetition, and this record is thin.
Thirteen episodes in 36.6 years cannot support a trading rule. Move the threshold between 1.5 and 3 standard deviations, or the look-back between three and ten years, and the count ranges from 7 to 18 across the twelve combinations. A rule estimated on a dozen events, three of which behave differently from the rest, ends up fitted to whichever kind happened most recently.
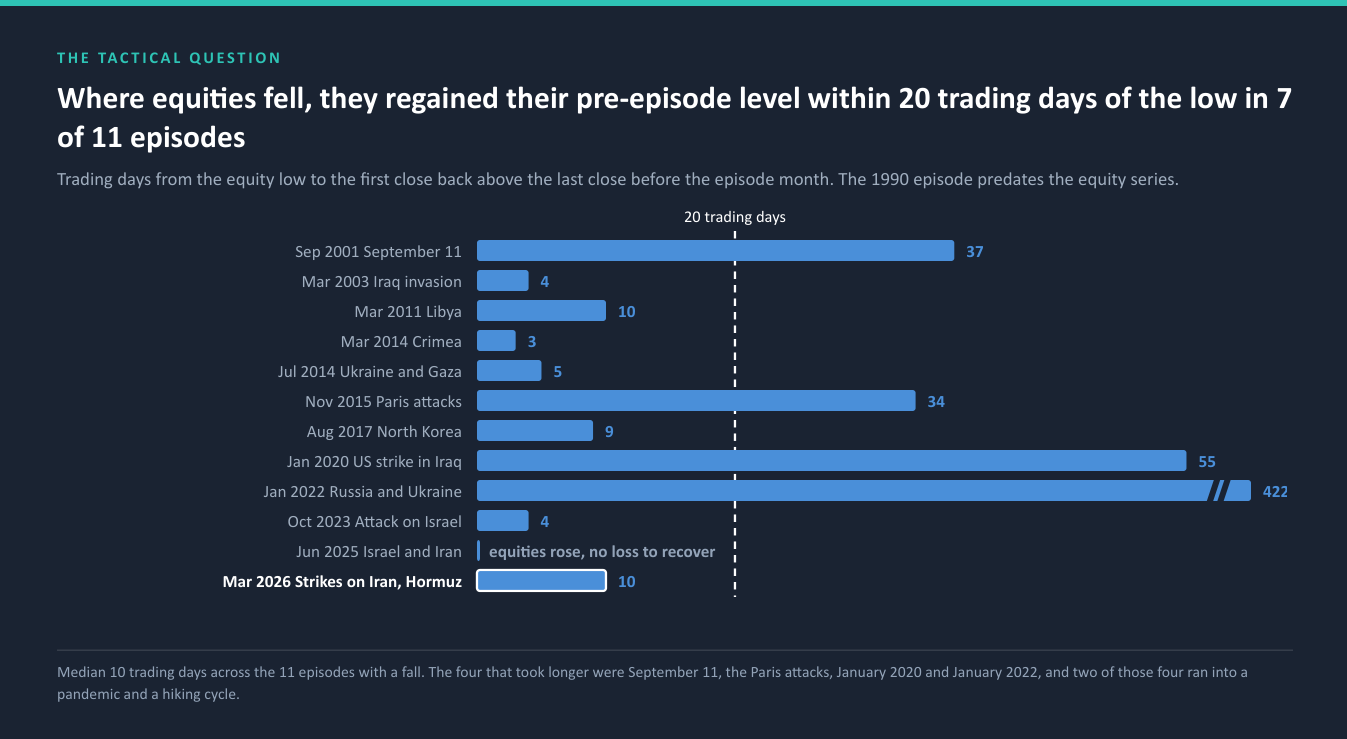
The equity loss usually reverses quickly. US equities fell in 11 of the 12 episodes we can measure; in June 2025 they rose through the episode month. In 7 of those 11, equities regained their level from the close before the episode within 20 trading days of their low, with a median of 10 trading days. The four that took longer were September 11, the Paris attacks, January 2020 and January 2022, and two of those four ran into a pandemic and a hiking cycle. Three months after the episode month, equities were higher in 8 of 12, by a median of 6.4%.
Trade shocks are a separate series. April 2025, the month of the largest US tariff announcements, is the highest of 500 months on the trade policy uncertainty index we hold. On the geopolitical risk index it ranks 59th of 500. A tactical process that treats every political headline as one risk is combining two shocks that the data records separately.
WHAT TACTICAL WORK IS FOR
The useful tactical role is preparation, not prediction: knowing in advance what will be sold, what will be bought and at what drawdown, so that a brief shock is met with a plan rather than with the reflex the flows in section 02 describe.
Strategically, a standard stress library carries the wrong shape for an energy shock
If geopolitical risk belongs anywhere, it belongs where portfolios are designed. So we examined the tools used to design them.
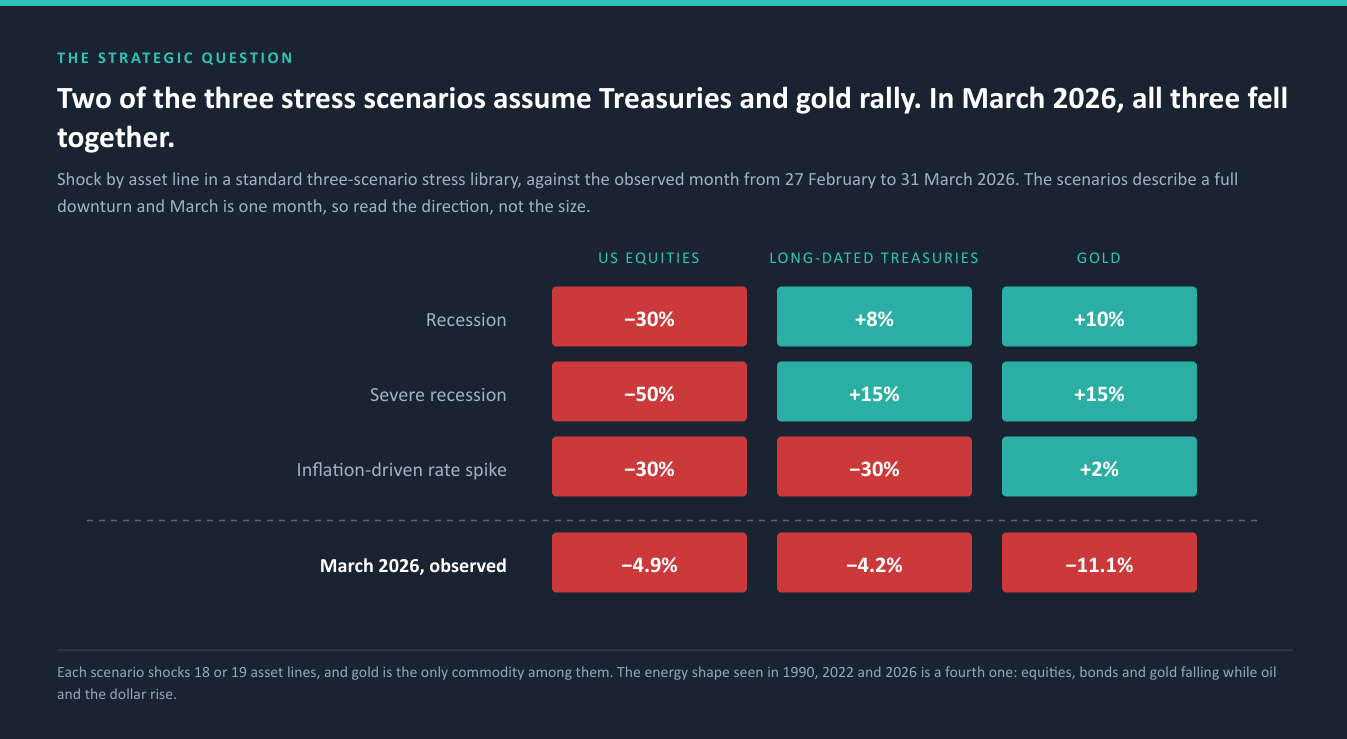
The stress library. A standard library we hold carries three scenarios: two recessions and an inflation-driven rate spike modelled on 2022. Each shocks 18 or 19 asset lines, and gold is the only commodity among them.
| Scenario | US equities | Long-dated Treasuries | Gold |
|---|---|---|---|
| Recession | -30% | +8% | +10% |
| Severe recession | -50% | +15% | +15% |
| Inflation-driven rate spike | -30% | -30% | +2% |
| March 2026, observed, one month | -4.9% | -4.2% | -11.1% |
The scenarios describe losses over a full downturn and March is a single month, so compare the direction of each line, not its size.
Two of the three scenarios assume the flight to safety the energy episodes did not deliver. The third gets the direction of bonds right and gives gold a small gain. The shape observed in 1990, 2022 and 2026 is a fourth one: equities, bonds and gold falling together while oil and the dollar rise.
Long-term assumptions leave a similar gap. Of the seven providers with 2026 long-term capital market assumptions in our data, one publishes a gold assumption, three publish a commodities line, two publish an energy line and four publish an inflation-linked bond line. A portfolio built on those inputs can hold a gold hedge that six of its seven assumption sets leave unpriced.
What strategic work looks like. Three pieces, each measurable.
1. Two geopolitical scenarios, defined by channel. A growth scare, calibrated to episodes such as September 2001 and January 2020, in which yields fall and duration hedges. An energy-supply shock, calibrated to 1990, 2022 and 2026, in which yields rise and duration adds to the loss.
2. A hedge sleeve tested against both. Treasuries, gold, the dollar, inflation-linked bonds, energy and cash each behave differently across the two shapes. A mix that survives both is a strategic answer. A mix that survives one is a bet on which kind comes next.
3. Assumptions reviewed through the channel. Where a structural change raises the odds of energy-driven shocks, the place to express it is in the inflation, real-asset and rate assumptions that feed the allocation, reviewed with each annual revision, not in a new asset bucket.
| Energy-supply shock, observed range in the episode month | 1990, 2022 and 2026 |
|---|---|
| Crude oil | +18.4% to +53.6% |
| Ten-year Treasury yield | +27bp to +50bp |
| US equities | -5.3% to -4.9% |
| Long-dated Treasuries | -4.2% to -3.9% |
| Gold | -11.1% to -1.7% |
Illustrative. Observed ranges, not a forecast. Equity, Treasury and gold ranges cover 2022 and 2026, the two energy episodes inside those price histories.
Our answer to the three questions
| Question | Our reading of the evidence |
|---|---|
| Strategic, tactical or both? | Both, unequally. The strategic portfolio does the work: scenarios defined by channel, a hedge sleeve tested against both, and assumptions reviewed through inflation and real assets. The tactical role is narrow: preparation and rebalancing discipline, not timing. |
| Why not tactical timing? | Thirteen episodes in 36.6 years, between 7 and 18 depending on the rule, three of which behave differently from the rest. Where equities fell, they recovered within 20 trading days of the low in 7 of 11. |
| Historical fit | The duration-and-gold playbook fitted shocks that hit growth, in a world where bonds moved against equities (-0.31) and real yields explained 73% of gold's level. |
| Recent fit | Since 2022 bonds have moved with equities (+0.55), and gold has risen 138.9% while real yields rose 3.5 percentage points. In the energy shocks of 2022 and 2026, both hedges fell with equities. |
THE READING
Treat geopolitical risk as a question about transmission. The useful test of a portfolio is whether it is hedged against a geopolitical shock that raises inflation. On the evidence of 2022 and 2026, the traditional hedge was built for the other kind.
What a portfolio team does about it
Four questions, answerable against your own book this week.
1. What did your hedges do in March 2026? Measure it line by line, from 27 February to 31 March. If the answer resembles section 01, your hedge sleeve is a growth-scare hedge. That can be the right design, and it should be a deliberate one.
2. How many of your stress scenarios have bonds and equities falling together while oil rises? That count is your coverage of the shock that has now happened twice in five years.
3. What correlation between equities and bonds do your risk numbers assume? A risk model estimated mostly on 2002 to 2021 carries a negative figure into a period in which the measured one has been +0.55. It will understate the risk of a balanced portfolio in precisely the shock this note describes.
4. What will you tell a client whose hedge lost money in a war? Section 02 shows allocators buying the traditional hedge while it fell. A manager who can explain the channel before the client asks turns a disappointing month into a conversation about portfolio design.
What we measured, and what we did not
The risk measure. The Geopolitical Risk index (Caldara and Iacoviello, American Economic Review, 2022), built from the share of newspaper articles covering wars, military threats and terrorism, as held on our platform: monthly from January 1985 to August 2026, and daily to 8 September 2026. It measures coverage of geopolitical events, not their economic cost. We use its level, its rank within its own history, and its distance from its own five-year average.
Episodes. A month in which the index stood at least two standard deviations above its trailing 60-month mean, the current month excluded. Spike months within two months of each other form one episode. The first month the rule can test is January 1990. Across thresholds of 1.5, 2, 2.5 and 3 standard deviations and look-backs of 36, 60 and 120 months, the count ranges from 7 to 18. Episode names describe the principal event of the month and are ours.
Windows. From the last trading day before the episode's first month to the last trading day of that month, and from there to three month-ends later. A monthly window captures everything else that happened in the month: January 2022 includes the repricing of US rates ahead of the hiking cycle, and the three months after January 2020 include the onset of the pandemic. Energy episodes are those in which crude oil rose more than 15% in the window; the next largest rise in any episode was 9.4%.
Markets. US equities and short, intermediate and long-dated Treasuries are total returns on exchange-traded funds tracking each market. Gold is a physically backed gold fund. The listing currency and primary price source were verified for every series. Equity history begins in 1993, Treasury funds in 2002, gold in 2004 and the broad dollar index in 2006, which is why earlier cells in the episode table read n/a. The ten-year nominal and real Treasury yields and crude oil are public market series. Correlations use monthly total returns. The gold relationship is a regression of the logarithm of the gold price on the ten-year real yield, monthly, January 2005 to December 2021, carried forward unchanged.
Flows. Weekly net flows for US-listed exchange-traded funds by category, the five readings dated 2 to 30 March 2026 and the six dated 19 January to 23 February. The comparison is the 2025 average weekly flow multiplied by five. US dollars.
Stress library and assumptions. A standard three-scenario stress library, shocks as specified. Long-term assumptions from the seven providers with a 2026 vintage in our data; a provider counts as publishing a line if any of its 2026 asset classes names it.
What we did not do. We have not forecast the next episode or the oil price, recommended an allocation, or modelled costs and taxes. We have not tested inflation-linked bonds, energy equities or currencies as hedges across the episodes, which is the natural next step.
Where this could be wrong. Three energy episodes are a small sample; the mechanism and the regime evidence support the reading, and a fourth energy shock arriving in a period of falling inflation could behave differently. A news-based index sees what newspapers cover. The gold relationship is a single-factor description of an asset with several drivers.
If this is useful
Run section 08 on your own book. The four questions can be answered from your own records.
Or send us one portfolio and we will return a single page: what its hedges did in March 2026, how it fares in a growth-scare and an energy-supply scenario side by side, and what stock-bond correlation its risk numbers assume.
Or let us map the channel across your product range. Which products carry energy-shock exposure their clients believe is hedged, measured on the same data.
Data appendix
Every figure below is read from the same single derivation as the note. n/a marks a price history that begins after the episode.
A1. Markets in the month each episode began
| Episode | Began | Spike months | Peak index | Ten-year yield | Long Treasuries | Gold | Oil | Dollar |
|---|---|---|---|---|---|---|---|---|
| Gulf War | Aug 1990 | 5 | 379.2 | +50bp | n/a | n/a | +33.4% | n/a |
| September 11 | Sep 2001 | 3 | 512.5 | -25bp | n/a | n/a | -12.0% | n/a |
| Iraq invasion | Mar 2003 | 1 | 358.7 | +12bp | -1.4% | n/a | -15.3% | n/a |
| Libya | Mar 2011 | 1 | 136.9 | +5bp | 0.0% | +1.6% | +9.4% | -1.0% |
| Crimea | Mar 2014 | 1 | 119.8 | +7bp | +0.7% | -3.1% | -1.3% | -0.2% |
| Ukraine and Gaza | Jul 2014 | 3 | 138.8 | +5bp | +0.7% | -3.6% | -7.4% | +1.3% |
| Paris attacks | Nov 2015 | 2 | 150.7 | +5bp | -0.9% | -6.8% | -13.2% | +1.9% |
| North Korea | Aug 2017 | 1 | 138.5 | -18bp | +3.2% | +4.2% | -5.9% | -0.4% |
| US strike in Iraq | Jan 2020 | 1 | 138.4 | -41bp | +7.7% | +4.5% | -15.6% | +0.9% |
| Russia and Ukraine | Jan 2022 | 4 | 319.0 | +27bp | -3.9% | -1.7% | +18.4% | +0.2% |
| Attack on Israel | Oct 2023 | 1 | 197.9 | +29bp | -5.5% | +7.4% | -10.1% | +1.2% |
| Israel and Iran | Jun 2025 | 1 | 222.6 | -17bp | +2.7% | +0.4% | +7.9% | -1.9% |
| Strikes on Iran, Hormuz | Mar 2026 | 2 | 330.2 | +33bp | -4.2% | -11.1% | +53.6% | +2.7% |
A2. US equities through each episode
| Episode | Began | Episode month | Low within three months | Trading days, low to recovery | Next three months |
|---|---|---|---|---|---|
| Gulf War | Aug 1990 | n/a | n/a | n/a | n/a |
| September 11 | Sep 2001 | -8.2% | -14.5% | 37 | +9.8% |
| Iraq invasion | Mar 2003 | +0.2% | -5.2% | 4 | +15.6% |
| Libya | Mar 2011 | 0.0% | -5.2% | 10 | 0.0% |
| Crimea | Mar 2014 | +0.8% | -2.1% | 3 | +5.2% |
| Ukraine and Gaza | Jul 2014 | -1.3% | -4.4% | 5 | +4.9% |
| Paris attacks | Nov 2015 | +0.4% | -11.5% | 34 | -6.7% |
| North Korea | Aug 2017 | +0.3% | -1.6% | 9 | +7.6% |
| US strike in Iraq | Jan 2020 | 0.0% | -30.3% | 55 | -9.2% |
| Russia and Ukraine | Jan 2022 | -5.3% | -13.0% | 422 | -8.1% |
| Attack on Israel | Oct 2023 | -2.2% | -3.9% | 4 | +15.9% |
| Israel and Iran | Jun 2025 | +5.1% | +0.6% | equities rose | +8.1% |
| Strikes on Iran, Hormuz | Mar 2026 | -4.9% | -7.6% | 10 | +15.1% |
A3. Episode count under twelve rules
| Threshold, standard deviations | 36-month look-back | 60-month look-back | 120-month look-back |
|---|---|---|---|
| 1.5 | 18 | 14 | 12 |
| 2.0 | 12 | 13 | 10 |
| 2.5 | 11 | 10 | 9 |
| 3.0 | 9 | 9 | 7 |
The rule used in the note is 2.0 standard deviations over 60 months, 13 episodes.
A4. The standard stress library, full shocks
| Asset line | Recession | Severe recession | Inflation-driven rate spike |
|---|---|---|---|
| US Large Cap | -30% | -50% | -30% |
| US Small Cap | -35% | -55% | -25% |
| AC World Equity | -30% | -52% | -28% |
| Japanese Equity | -28% | -45% | -20% |
| Chinese Domestic Equity | -32% | -50% | -25% |
| Euro Area Large Cap | -30% | -52% | -25% |
| Emerging Markets Equity | -35% | -55% | -22% |
| US Aggregate Bonds | +5% | +8% | -15% |
| US Intermediate Treasuries | +6% | +10% | -12% |
| US Long Treasuries | +8% | +15% | -30% |
| US Investment Grade Corporate Bonds | -5% | -10% | -18% |
| US High Yield Bonds | -15% | -30% | -12% |
| US Leveraged Loans | -12% | -25% | -5% |
| Private Equity | -25% | -40% | -15% |
| US Core Real Estate | -15% | -35% | -25% |
| Gold | +10% | +15% | +2% |
| US Cash | +3% | +2% | +2% |
| Diversified Hedge Funds | -5% | -15% | -8% |
| TIPS | n/a | n/a | -10% |
Important information
Important information. Published by Three Horizons Capital for general information and education. It is not investment, legal, tax or accounting advice, not a research recommendation, and not an offer or solicitation to buy or sell anything. It is not a personal recommendation and takes no account of any person's objectives, financial situation or needs. Three Horizons Capital is not a regulated entity. No fund, provider, ticker, manager or issuer is named anywhere in this material; the geopolitical risk index is cited by its published academic source. Figures derive from the Three Horizons Capital data platform and were fixed to a single derivation on 14 September 2026, from which the text and every chart read. Past performance is not a guide to future performance, and the behaviour described here may not persist.