Portfolio construction
The Diversifier That Stopped Diversifying
We took six regional family office model portfolios and measured their bond sleeves against the forward assumptions a major bank published for 2026, against realized markets and against where investor money has actually gone. The planning model has not given up on bonds. It has given up on the kind of bonds most of these portfolios hold, and more new money has gone back into that kind than into any other.
Three Horizons Capital · Research Paper 42 · October 2026
+0.64 against +0.14
The forward correlation between the US model's equities and the bond sleeve it holds, against the same weight in hedged global government bonds. US Treasuries sit at about zero.
−4.0% against −0.7%
What the planning model implies the US bond sleeve does in a 20% equity fall, as held, against hedged global government bonds. US Treasuries hold flat.
48% against about 14%
The share of 2024 and 2025 US bond fund inflows that went into aggregate and credit funds, against government funds of all maturities.
The finding in one line
It is not bonds that stopped cushioning equities. It is the bonds family office portfolios hold.
The gap
Every one of the six model portfolios still holds a bond sleeve of 12% to 26%. The question is what that sleeve is expected to do when equities fall.
We measured it directly. For each model we took the equity sleeve and the bond sleeve as held, and computed the forward correlation between them from the published 2026 assumptions: every volatility and every pairwise correlation, not one proxy pair.
The sleeves as held come out at +0.22 to +0.64: the US at +0.64, the Middle East at +0.55, China at +0.47, Australia at +0.27, Europe at +0.25 and Japan at +0.22. The same weight in hedged global government bonds would sit between +0.09 and +0.15 in every region. The same weight in US intermediate Treasuries would sit at about zero.
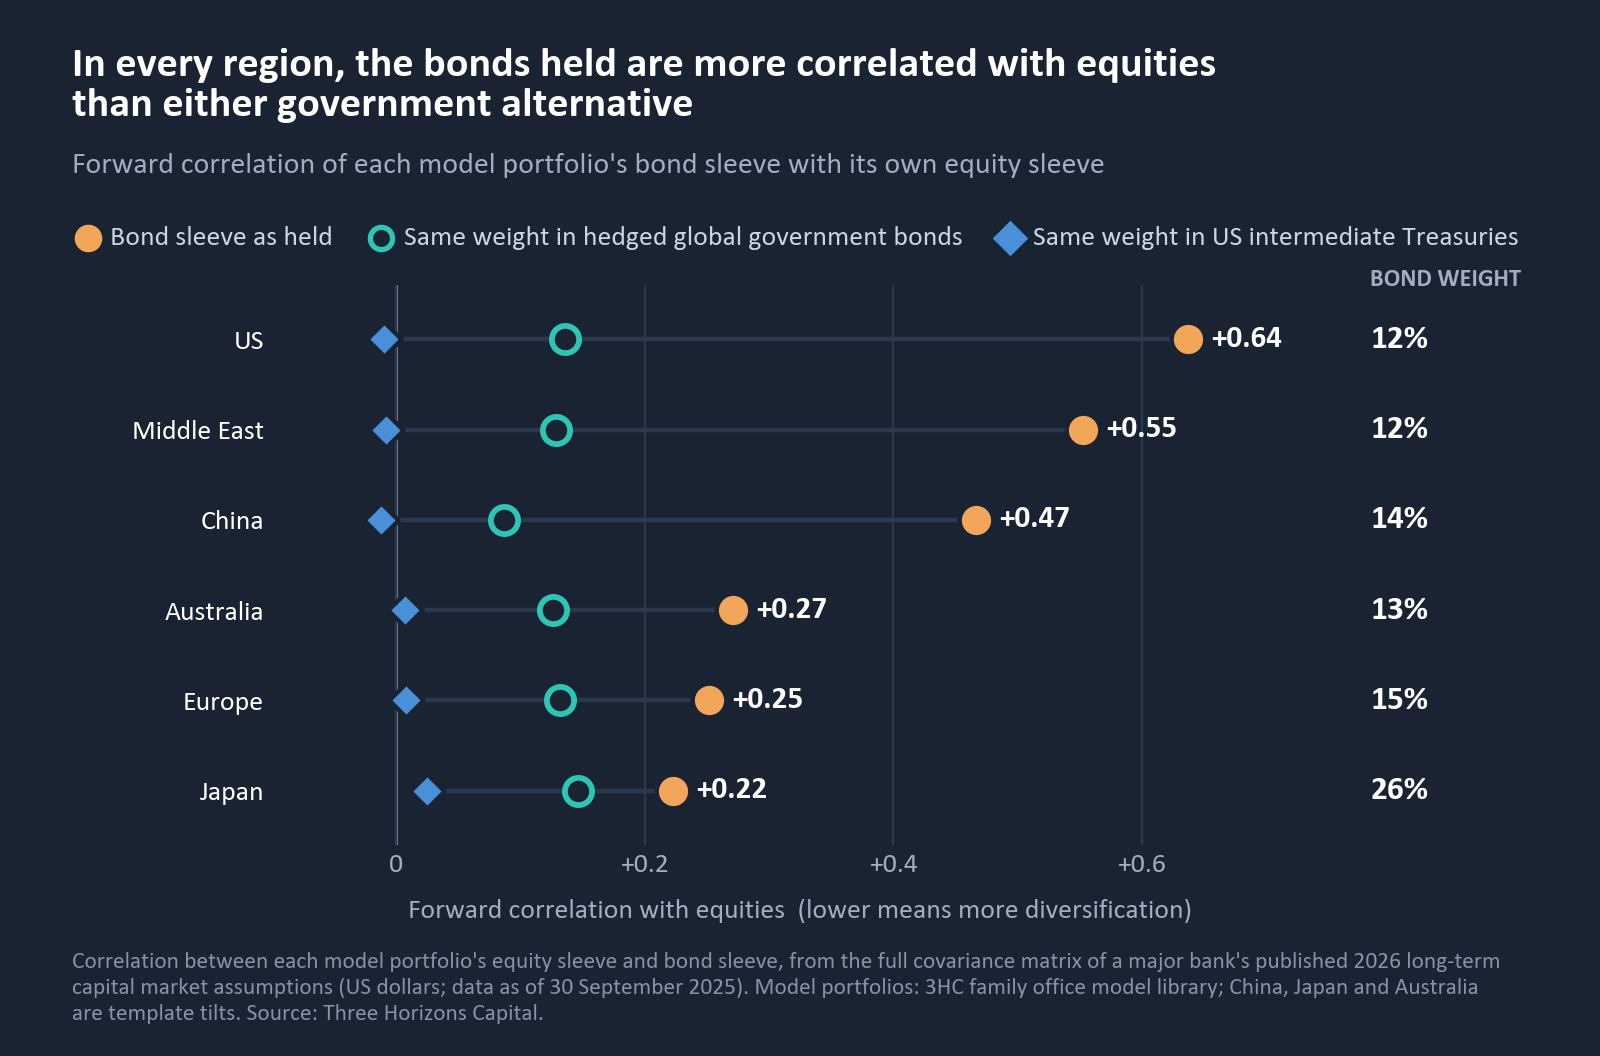
The spread is driven by what the sleeves contain. The US sleeve holds high yield alongside aggregate bonds. The Middle East and China sleeves hold emerging-market sovereign debt. Japan holds mostly hedged global government bonds, which is why it sits lowest.
This is an observation, not a forecast. It describes the portfolios against the assumptions their own planning process uses.
What the planning model actually says
It is often said that the industry has stopped expecting bonds to diversify equities. The published 2026 assumptions say something more precise.
Against US large-cap equities, US intermediate Treasuries carry a forward correlation of -0.01. Hedged global government bonds carry +0.14. US aggregate bonds carry +0.30, and inflation-linked Treasuries +0.34. The pattern repeats across regions: world equities sit at 0.00 against Treasuries and +0.33 against aggregate bonds.
The model has not given up on bonds. It has given up on credit-heavy and inflation-linked bonds as a cushion. Government duration still does the job, in the model's view.
What realized markets show
The planning model is not out on its own. Realized markets show the same ranking.
The correlation between US large-cap equities and US aggregate bonds turned positive in 2020, not 2022. It was -0.16 from 2013 to 2019, +0.43 in 2020 and 2021, +0.38 in 2022, +0.19 from 2023 to 2026, and +0.31 over the last 52 weeks. The 2022 bond shock was a second crossing, not the first.
The ranking by bond type holds in realized data. Over the last 52 weeks, US high yield ran at +0.65 against US equities, aggregate bonds at +0.31 and intermediate Treasuries at +0.24. Over 2023 to 2026 the figures were +0.67, +0.19 and +0.08.
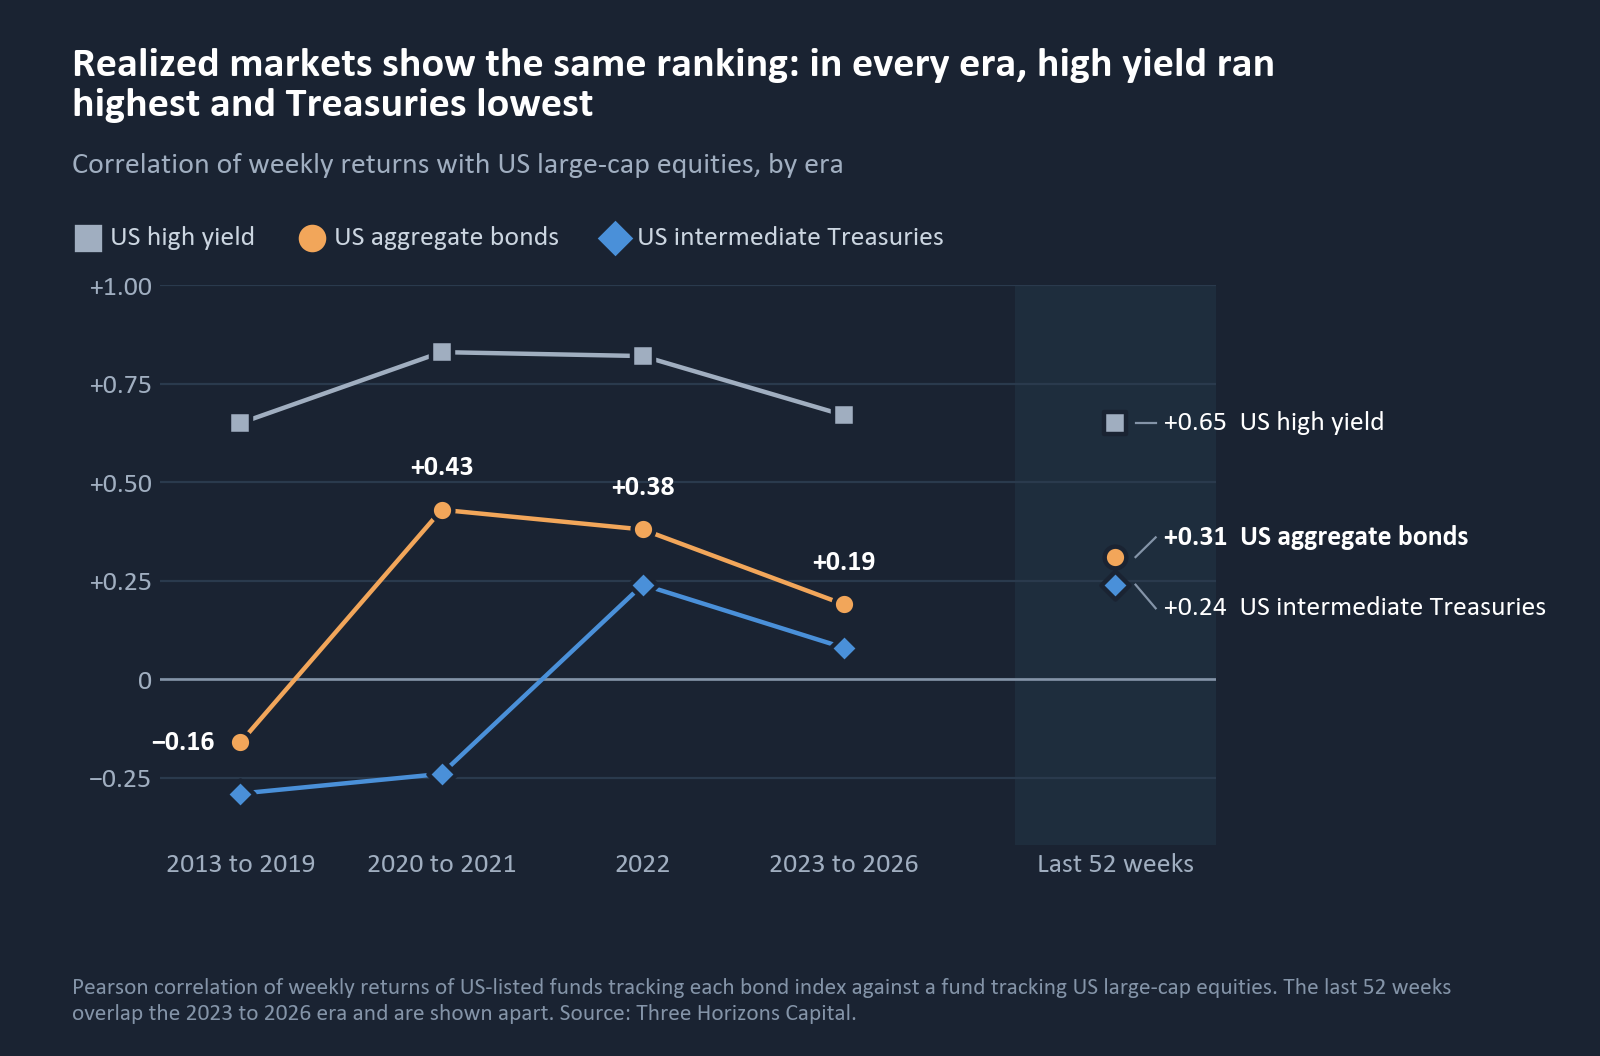
One caution in the other direction. Treasuries have recently correlated more with equities (+0.24 over the last year) than the model assumes (-0.01). Government duration is the better cushion, not a free one.
Where the money went
US fund investors did sell bonds. In 2022, US-domiciled bond mutual funds and ETFs saw a net outflow of $270bn, after inflows of $493bn to $674bn a year from 2019 to 2021.
Then the money came back. Inflows were $238bn in 2023, $536bn in 2024 and $631bn in 2025.
What matters is where it went. Of $1,167bn of net bond inflow in 2024 and 2025, $556bn, or 48%, went into aggregate and credit funds: core and core-plus, multisector, high yield and corporate. Government funds of all maturities took about 14%: 7% into intermediate and long government funds and most of the rest into Treasury and T-bill funds classed as ultrashort. Municipal bond funds took 10%, other ultrashort funds 6%, and the remaining 23% was spread across global, securitized, inflation-protected, target-maturity, short-term and other bond funds. Shares are rounded.
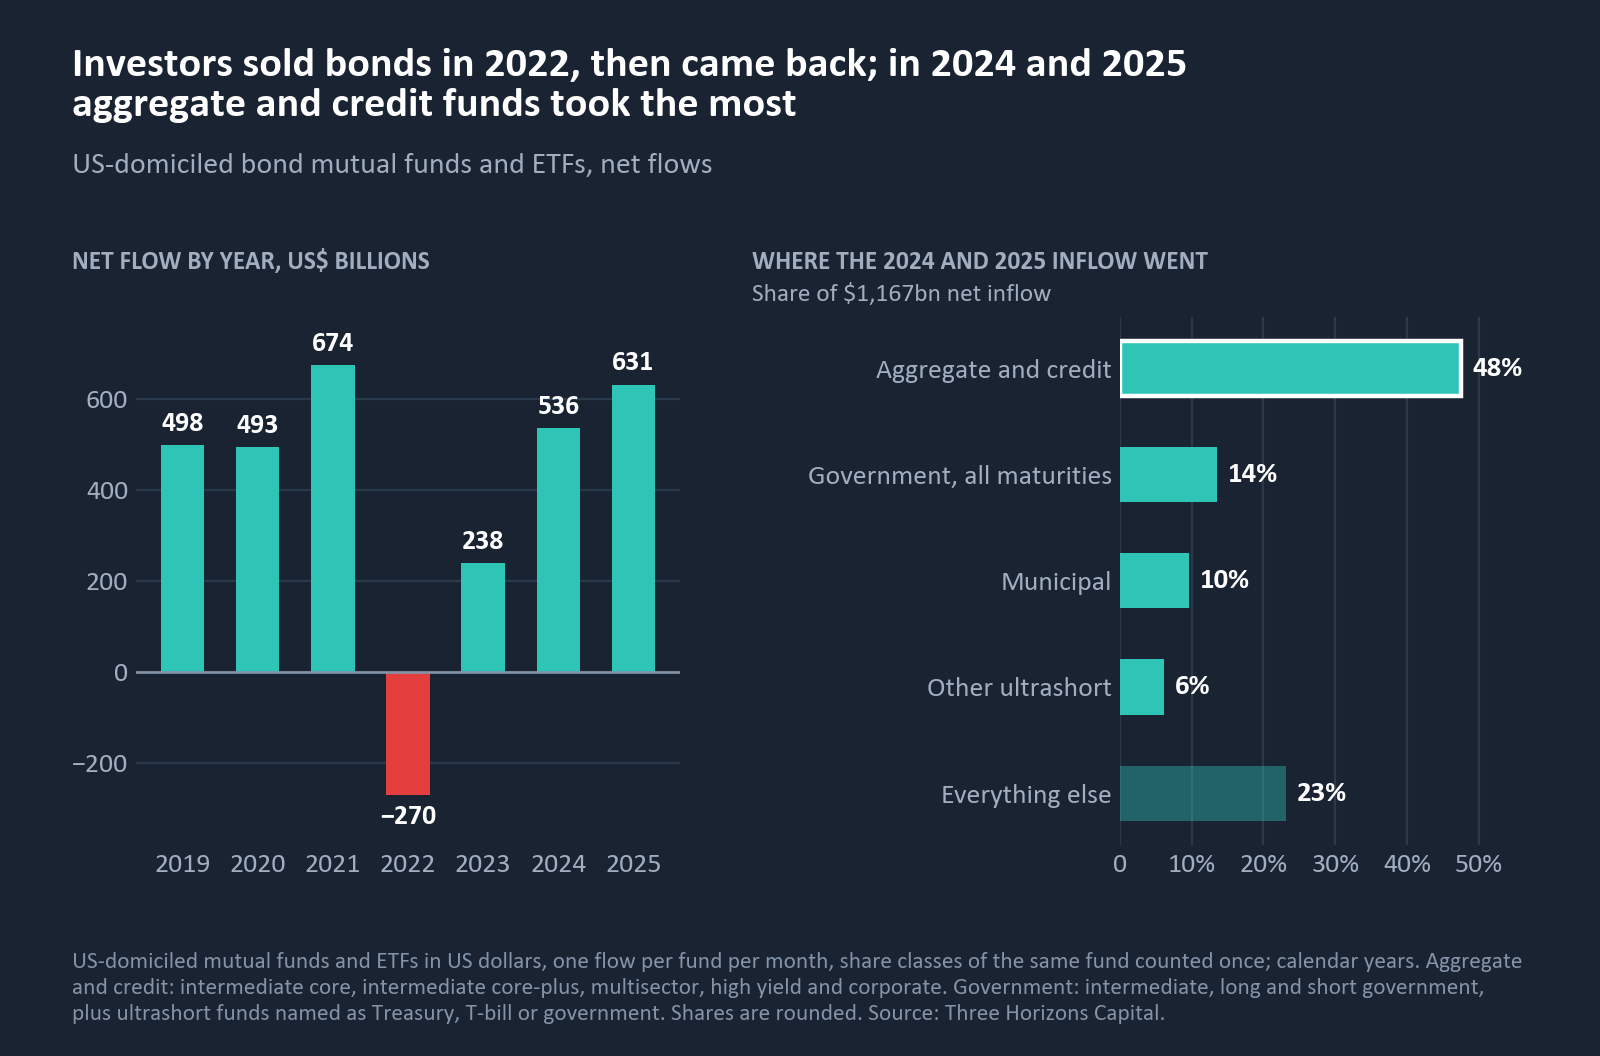
These are flows for all US fund investors, not family offices alone. They show the market direction: back into bonds, and more into the kind the planning model says will not cushion equities than into any other.
The cost of the gap in a real portfolio
Start with the arithmetic a careful reader will do. In a 20% fall in the US model's equities, the 12% bond sleeve as held is expected to lose about 4.0%, which is about 0.5% of the whole portfolio. In hedged global government bonds the same sleeve would lose about 0.7%, or about 0.1% of the whole portfolio. The difference is about 0.4 points.
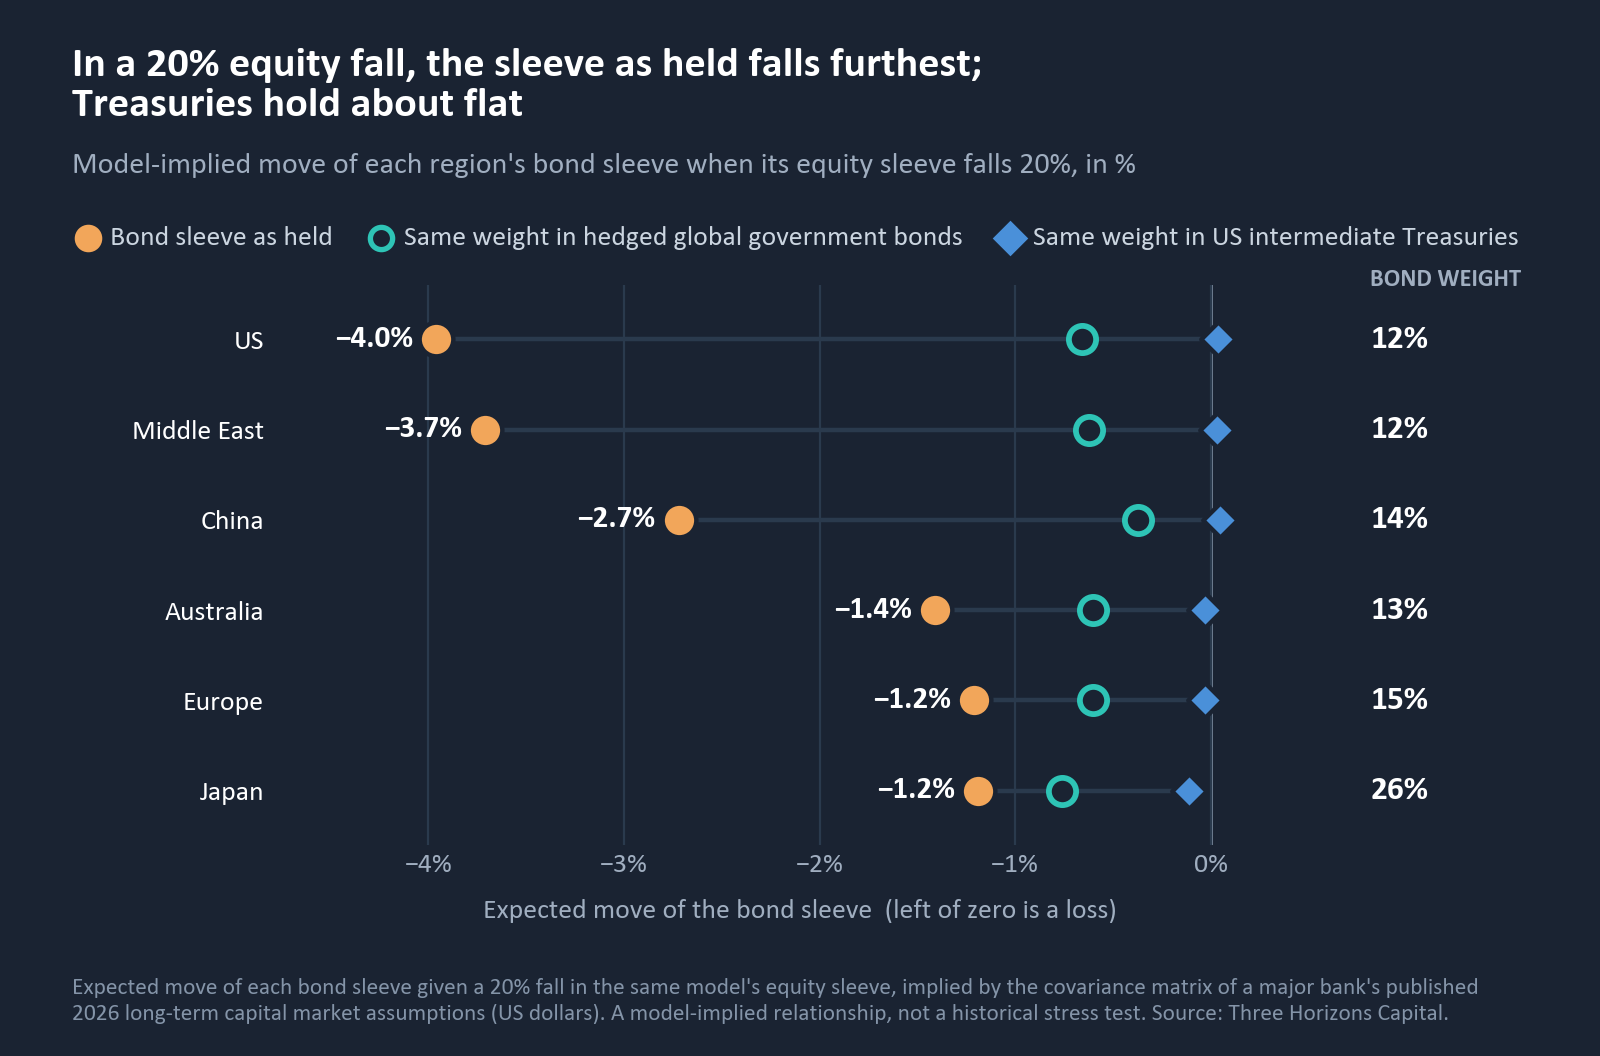
Against that, the same 20% fall implies the whole portfolio loses about 13%: 6.8 points from the listed equities themselves and most of the rest from private equity, real estate and the other growth assets that move with them. Growth drives 92% of this portfolio's risk.
So the point is not that the bonds cause the loss. It is that the sleeve labelled as the cushion is not doing that job, and the portfolio around it behaves as a growth portfolio. That is the conversation a committee should have, and it is why risk by source matters more than the weights on the page.
We ran the US model through our risk engine three ways, using the same 2026 assumptions.
| US model | Bond sleeve | Expected return (compound) | Volatility | Sharpe ratio | 1-day VaR 95% | Portfolio in a 20% equity fall |
|---|---|---|---|---|---|---|
| As built | 8% aggregate, 4% high yield | 7.57% | 11.23% | 0.454 | 1.13% | -13.0% |
| Government duration | 12% hedged global government bonds | 7.48% | 10.86% | 0.458 | 1.09% | -12.6% |
| Duration plus real assets | 6% hedged global government bonds, 3% core infrastructure, 3% core real estate | 7.66% | 11.21% | 0.462 | 1.13% | -12.9% |
Sharpe ratios use the arithmetic expected returns (8.20%, 8.07% and 8.28%) less cash, as the appendix explains. Changing the sleeve is not a free lunch. Moving the 12% from aggregate and high yield into hedged global government bonds lowers expected return by about 0.1 point a year and volatility by about 0.4 points, leaving the Sharpe ratio almost unchanged. Splitting the sleeve between hedged government bonds and real assets keeps the return and the volatility close to where they were. Real assets are a return and inflation decision, not a substitute for a cushion.
The Middle East sleeve, at -3.7% in the same 20% fall, and the China sleeve, at -2.7%, show the same pattern as the US.
The lens you measure in changes the answer
Generic assumptions are built in one currency. Family offices invest in many.
The published assumptions put Chinese domestic equities at +0.19 against US aggregate bonds. Measured in US dollars, a China A-share fund and a China government bond fund have realized +0.28 over the last 52 weeks. The right answer depends on the currency the family office reports in.
Japan carries the largest bond sleeve, 26%, mostly hedged global government bonds. With yield-curve control ended in March 2024, Japanese yields now move more freely than they did, which makes the hedged duration choice more important, not less.
The point is not that the planning model is wrong. It is that a generic assumption set needs local calibration before it sizes a family office's bond sleeve.
Data confidence
We publish what each region's conclusions rest on, because a family office should know.
| Region | Model portfolio | Flow evidence | Correlation evidence | Confidence |
|---|---|---|---|---|
| United States | 3HC family office model | US fund flows, 2019 to 2026 | Direct US pairs | Strong |
| Europe | 3HC family office model | Not used | Proxy pairs with US bonds | Partial |
| Middle East | 3HC family office model | None available | World equities against US bonds | Partial |
| China | Template tilt | Proxies too noisy | USD-listed proxies; onshore differs | Partial |
| Japan | Template tilt | Immaterial in funds | Direct pair | Partial |
| Australia | Template tilt | Short history | International equities against US bonds | Partial |
All six models are expressed in US dollar asset classes, because the assumption set we use is in US dollars. A European or Asian family office would hold local cash and local bonds; the analysis should be rerun in its own currency.
Six questions for your own portfolio
1. What is the forward correlation of the bonds we actually hold, not of "bonds"?
2. How much of our bond sleeve is credit risk wearing a fixed-income label?
3. What does our bond sleeve do in a 20% equity fall, as held?
4. If the sleeve is not there to cushion equities, what is it for: income, liquidity or a liability match?
5. Are our long-term assumptions calibrated to the currency and market we report in?
6. Does our investment committee see risk by source, or only weights?
Run it on your own portfolio
Every number in this paper comes from connecting published assumptions, market data and fund flows to an actual portfolio. That is the work. 3HC runs this analysis on your actual holdings, in your reporting currency: the forward correlation of the bonds you hold, what they do in a sell-off, and what a different sleeve would cost and save.
To discuss your own portfolio: threehorizonscapital.com/contact
Appendix: the six model portfolios and method
Model portfolios. Six regional family office model portfolios from the 3HC family office model library, rebuilt June 2026. The US, Europe and Middle East models are 3HC models; China, Japan and Australia are template tilts with disclosed assumptions (home-equity bias, government-bond proxy substitution and an infrastructure overweight respectively). Bond sleeves as held: US 8% aggregate and 4% high yield; Europe 8% aggregate and 7% hedged global government; Middle East 8% aggregate and 4% emerging-market sovereign; China 10% aggregate and 4% emerging-market sovereign; Japan 18% hedged global government and 8% aggregate; Australia 8% aggregate and 5% hedged global government.
Forward correlations. Computed between each model's equity sleeve and bond sleeve from the full covariance matrix (weights, volatilities and pairwise correlations) of a major bank's published 2026 long-term capital market assumptions in US dollars, data as of 30 September 2025. Our stored correlations and volatilities were checked against the published matrix.
Sell-off estimate. The expected move of each bond sleeve given a 20% fall in the same model's equity sleeve, implied by the same covariance matrix. It is a model-implied relationship, not a historical stress test.
Construction test. The 3HC risk engine's forward analysis on the US model, using the same volatilities and correlations; 1-day parametric VaR. Expected return is the compound return implied by the published 2026 arithmetic returns and the portfolio's volatility. Sharpe ratio is the arithmetic expected return less the published cash return (3.1%), divided by volatility. The portfolio move in a 20% equity fall applies each asset's model-implied relationship to the listed equity sleeve.
Realized correlations. Weekly returns of US-listed funds tracking US large-cap equities, US aggregate bonds, US intermediate Treasuries, US high yield, world and international equities, China A-shares and China government bonds; data to 9 October 2026.
Flows. US-domiciled mutual funds and ETFs in US dollars, one flow per fund per month (share classes of the same fund counted once), data to 30 September 2026. Aggregate and credit: intermediate core, intermediate core-plus, multisector, high yield and corporate bond categories. Government: intermediate, long and short government categories, plus ultrashort funds named as Treasury, T-bill or government funds.
Important information
This paper is issued by Three Horizons Capital for professional investors only and is not intended for retail investors. It is for information and discussion and does not constitute investment, legal, tax or accounting advice, an offer or solicitation to buy or sell any security or fund, or a recommendation of any strategy. The model portfolios are illustrative constructions and are not portfolios managed for any client. Forward-looking figures, including expected returns, correlations and the effect of an equity fall, are model-implied estimates derived from third-party long-term capital market assumptions; they are not forecasts or guarantees, and actual outcomes will differ. Realized correlations and fund flows are historical and are not a reliable indicator of future results. Third-party data is believed to be reliable but is not guaranteed, and remains the property of its owners. Three Horizons Capital accepts no liability for any loss arising from use of this paper. Source: Three Horizons Capital.