Fixed income
The Chart Is Right. The Story Is Wrong.
China's Treasury holdings, and the difference between what official data records and what it can see.
Three Horizons Capital · 20 September 2026 · Data as at: Treasury holdings to July 2026, US debt outstanding to August 2026, reserves and gold to August 2026. US dollars.
14.02% to 1.96%
China's holdings as a share of all marketable US Treasuries, July 2011 peak to July 2026
9.84 of 12.06 points
of that fall is US debt issuance rather than any change in Chinese holdings
53.1% against 7.1%
the fall in China's reported holdings, against China plus Belgium and Luxembourg combined
The finding in one line
The chart is accurate, four fifths of it is the United States borrowing more, most of the rest is matched by a rise in two custodial jurisdictions, and the reporting system cannot tell you whether that is the same money.
The chart is accurate. The conclusion drawn from it is not.
A chart has been circulating. It shows China's holdings of US Treasuries as a share of all Treasuries outstanding, rising to 14% around 2011 and falling to 2% today, with a red arrow drawn between the two ends. The implication travels faster than the chart: China is selling, and something is breaking.
The chart is accurate. We rebuilt it from the US Treasury's own releases and it reproduces to the decimal. Peak 14.02% in July 2011. Today 1.96%.
The conclusion drawn from it is wrong in three separate ways, and the reasons are worth more than the correction.
Four fifths of that fall is US borrowing, not Chinese selling
A share has two moving parts. Everyone is reading the numerator.
Since July 2011 the stock of marketable US Treasury debt has gone from $9.38tn to $31.46tn. It more than tripled. Hold China's holdings perfectly flat at their July 2011 level, change nothing about Chinese behaviour at all, and the share still falls from 14.02% to 4.18% purely because the denominator grew.
Of the 12.06 point fall, 9.84 points are US issuance and 2.22 points are the change in Chinese holdings.
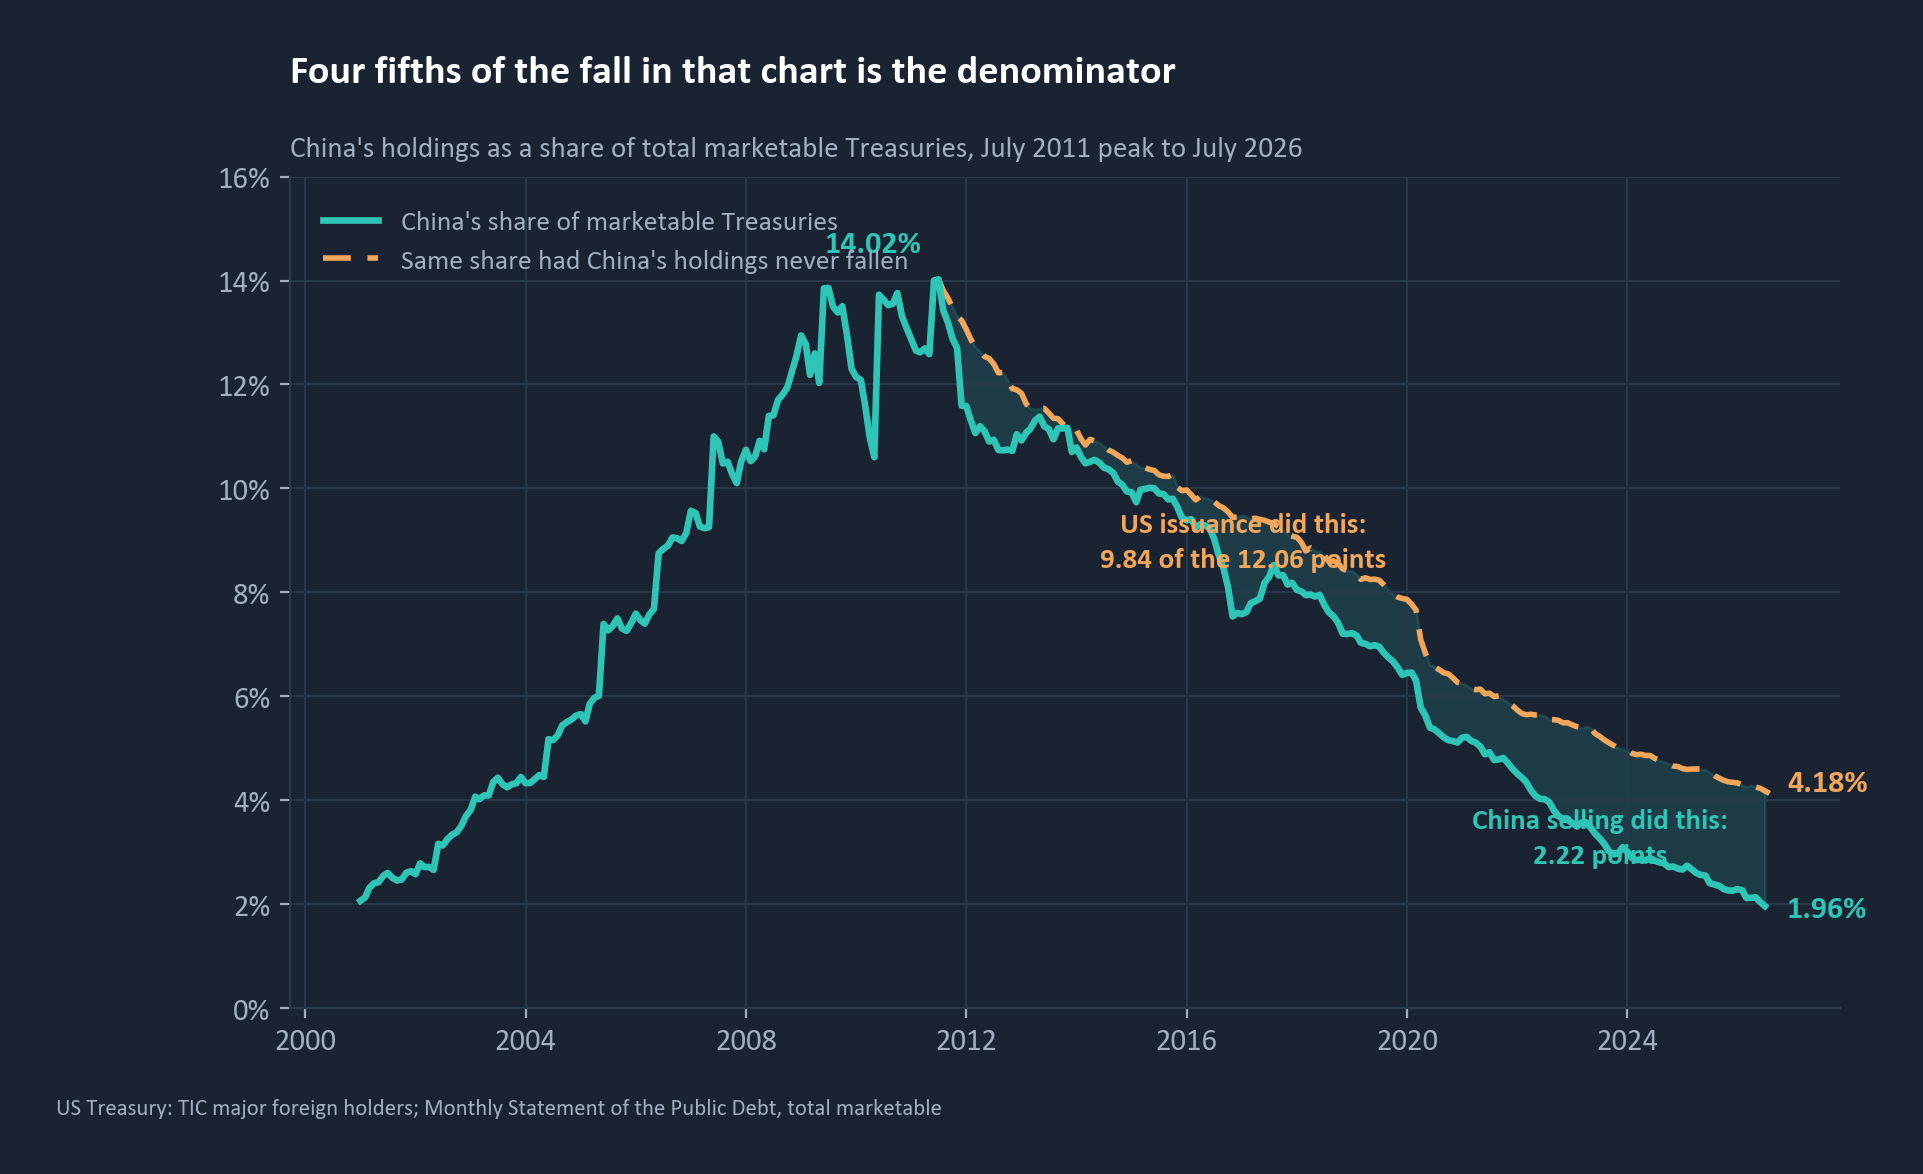
The chart is substantially a picture of American fiscal expansion wearing a Chinese label. That is the first thing to know about it, and it is the thing nobody in the thread said.
China's holdings did fall by half, and two other lines rose by most of it
The 2.22 points are real. China's reported holdings peaked at $1,316.7bn in November 2013 and stood at $618.0bn in July 2026, a fall of 53.1%. July's release is a new low.
Now add two countries.
Belgium and Luxembourg are home to Europe's two large international bond custodians. The US Treasury counts a foreign holding by where the security is custodied, not by who owns it, and says so in the notes to its own table: securities held in overseas custody accounts may not be attributed to their actual owners.
Over the same period Belgium and Luxembourg's reported holdings rose from $331.0bn to $912.8bn.
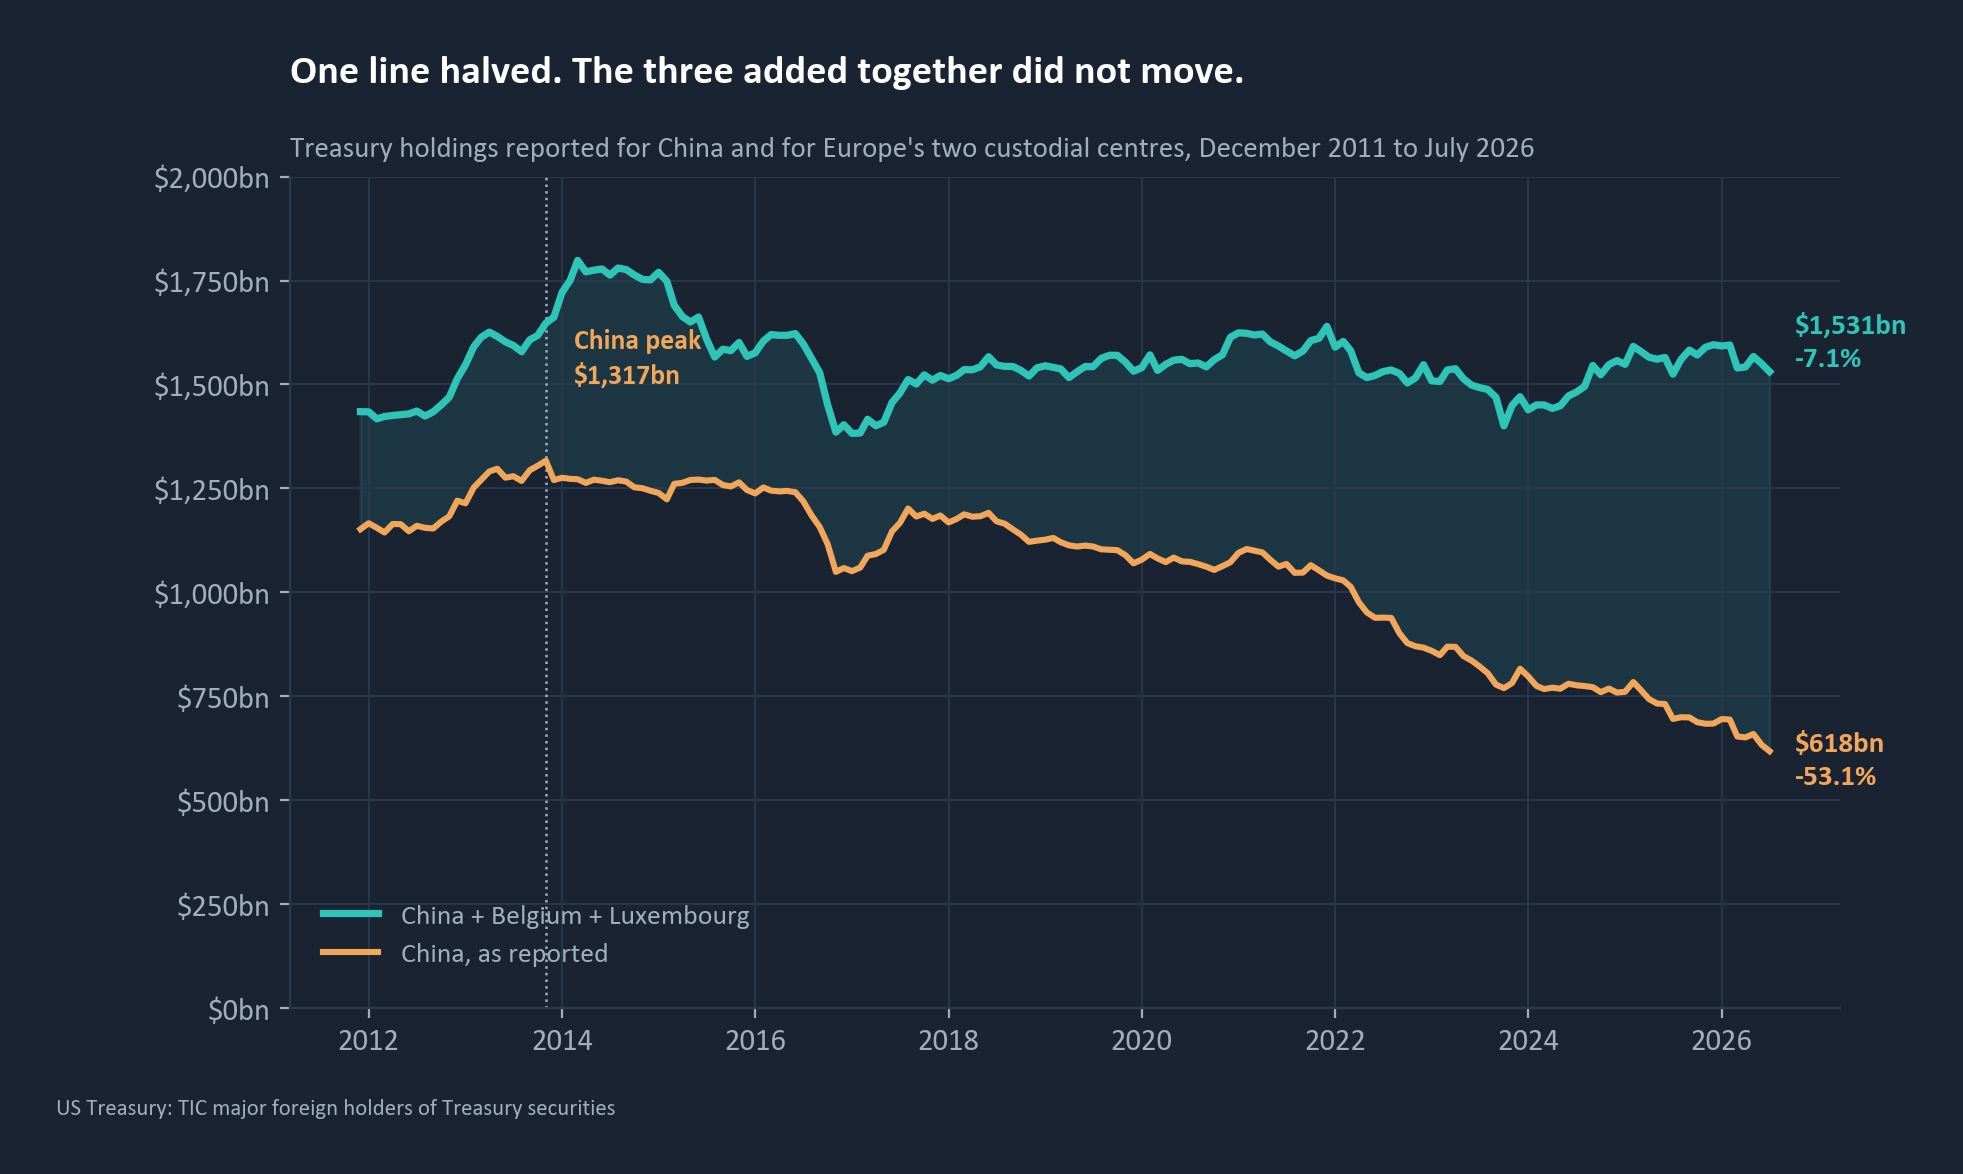
China alone: down 53.1%. China plus Belgium plus Luxembourg: down 7.1%. The combined line has sat between roughly $1.38tn and $1.80tn for fourteen years.
We are not claiming those European holdings are China's. Nobody outside Beijing can make that claim, and we will come back to why the honest version of this is narrower than the popular one. The point is simpler and harder to argue with. China's reported holdings fell $698.7bn from the peak. Belgium and Luxembourg's rose $581.8bn over the same period, 83% of the fall, and the reporting system cannot tell you whether that is the same money.
The one time the total genuinely moved, China's line said nothing
Between June 2014 and January 2017 China's foreign exchange reserves fell from a peak of $3.99tn to below $3tn. Roughly $990bn left, the largest reserve drawdown in the country's history, driven by capital outflow and by defending the currency through the August 2015 devaluation.
Belgium's reported Treasury holdings peaked at $381.4bn in March 2014 and reached $110.7bn by August 2015. A fall of $270.7bn, or 71.0%, in seventeen months.
China's reported Treasury line over exactly that window went from $1,272.1bn to $1,270.5bn. It moved $1.6bn.
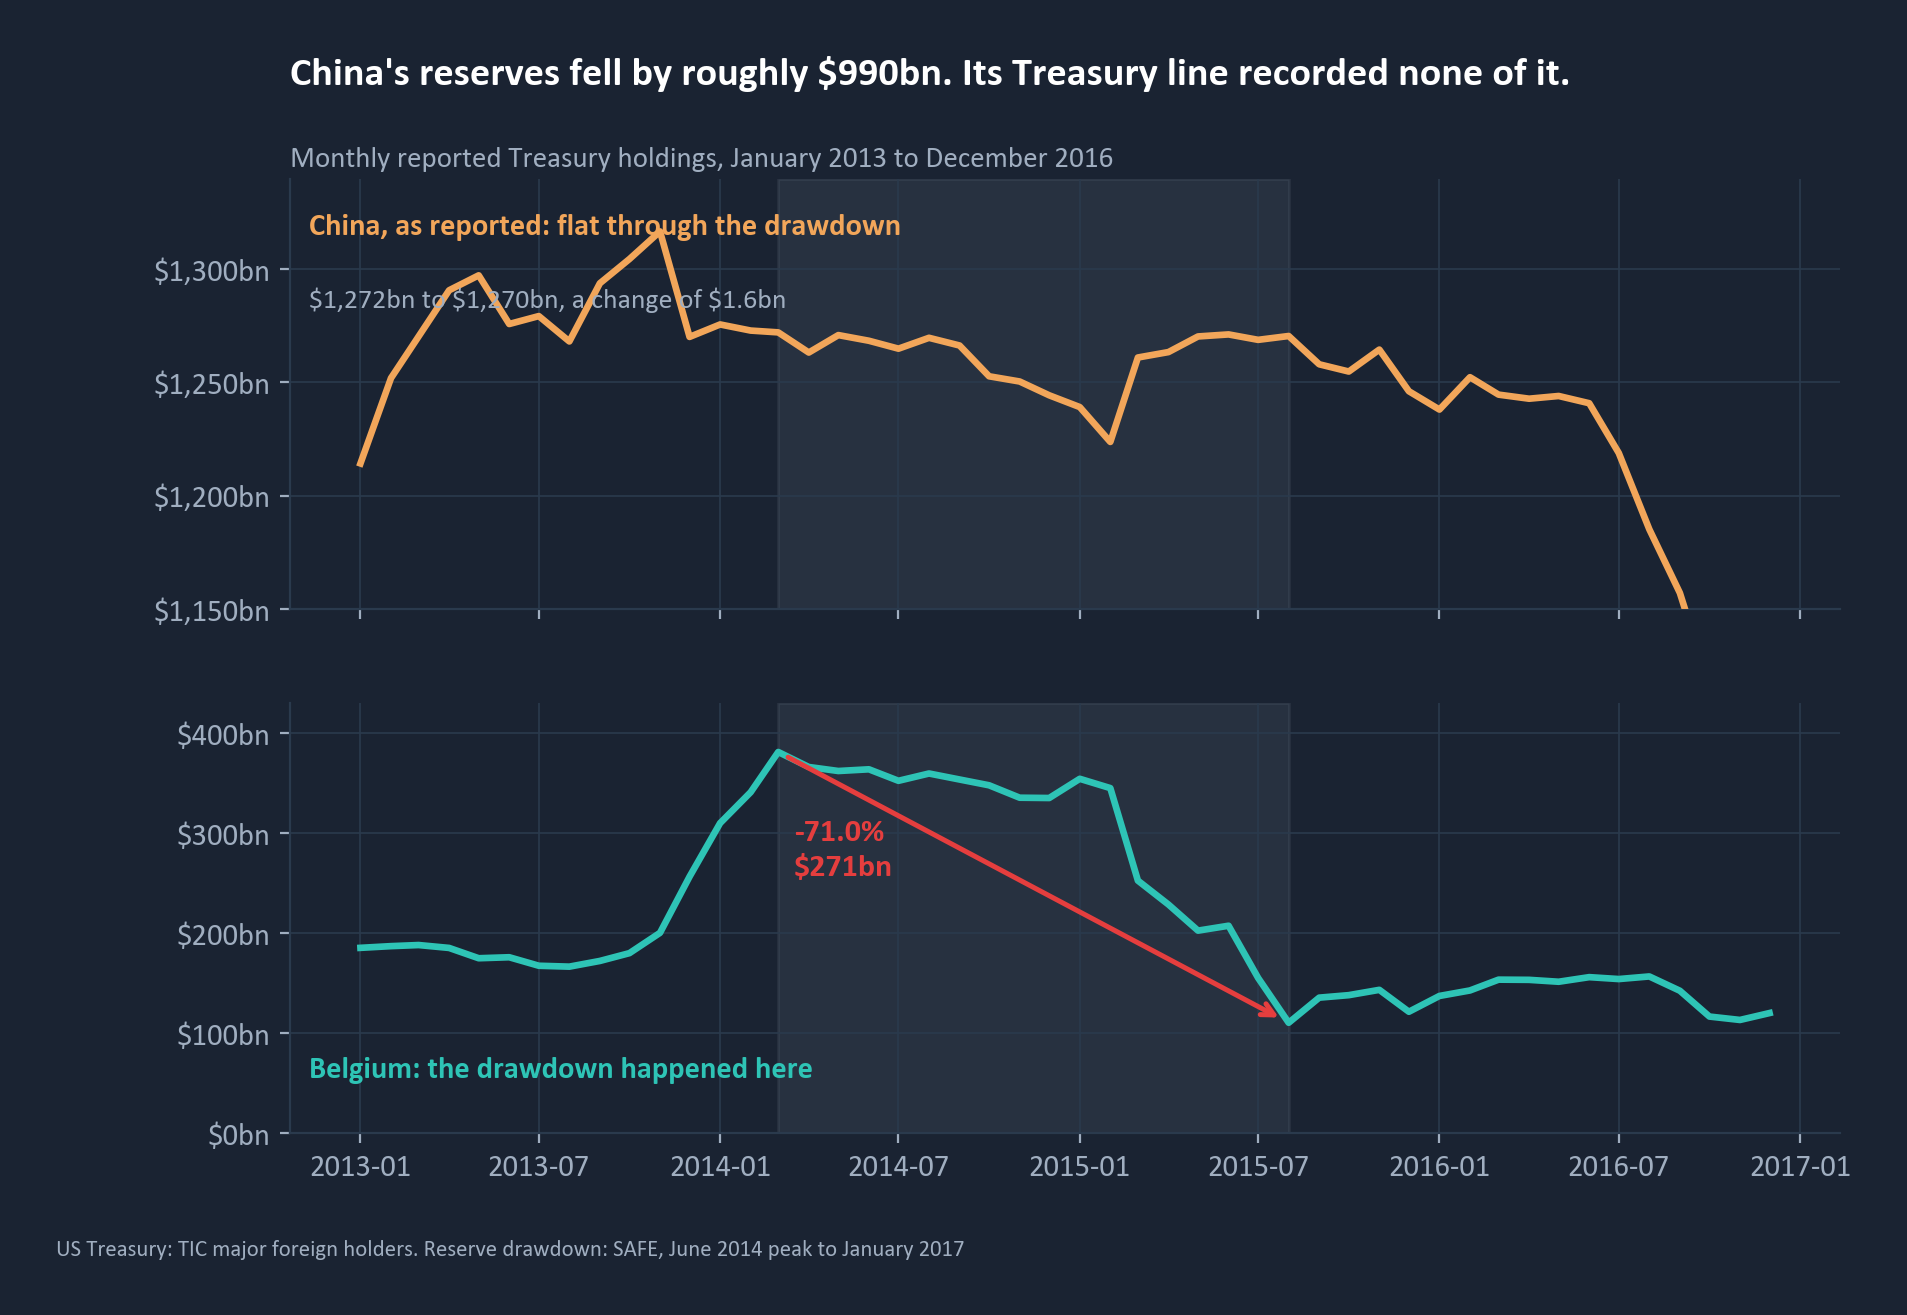
This is the episode that matters, and it is usually told as evidence that China moves assets between custodians. It supports something more useful. Whether that $270.7bn was sold to defend the yuan or moved somewhere else entirely, the official China series recorded almost none of it. Relocation and liquidation leave the same footprint in the data. During the single largest test of the series, it was close to silent.
That is the case for treating official reserve data as a floor rather than a measurement. It requires no estimate and no attribution.
The monthly relationship people cite does not survive a significance test
Here is where we part company with the popular version, including our own first pass at it.
The common claim is that China's holdings and Belgium's move inversely, month to month, as a mechanical offset. Test it on 175 monthly observations.
| Window | Observations | Correlation | p | Rank correlation | p |
|---|---|---|---|---|---|
| 2012 to 2026 | 175 | -0.10 | 0.18 | -0.05 | 0.54 |
| 2013 to 2015 | 36 | -0.39 | 0.02 | -0.15 | 0.38 |
| 2022 to 2026 | 55 | +0.11 | 0.41 | +0.18 | 0.19 |
Across the full sample there is no relationship distinguishable from zero. Since 2022 the sign is positive. The 2013 to 2015 window, the one always cited, produces a headline coefficient of -0.39 that looks persuasive until you rank the observations, at which point it falls to -0.15 and any claim to significance goes with it. A handful of large months are carrying it.
There is no month-to-month mechanical offset. Anyone building a model on one is calibrating to noise.
The mechanism is still real. It simply shows up in the composition of the stock, not in the monthly flow, and that distinction is the difference between an argument that holds and one that gets taken apart.
A third of all foreign-held Treasuries now sits in six jurisdictions
Belgium, Luxembourg, the United Kingdom, Switzerland, Ireland and the Cayman Islands together hold $3,006bn of US Treasuries, 32.5% of everything held outside the United States. In January 2012, the first month on the current reporting basis for which all six are itemised, that figure was 14.4%.
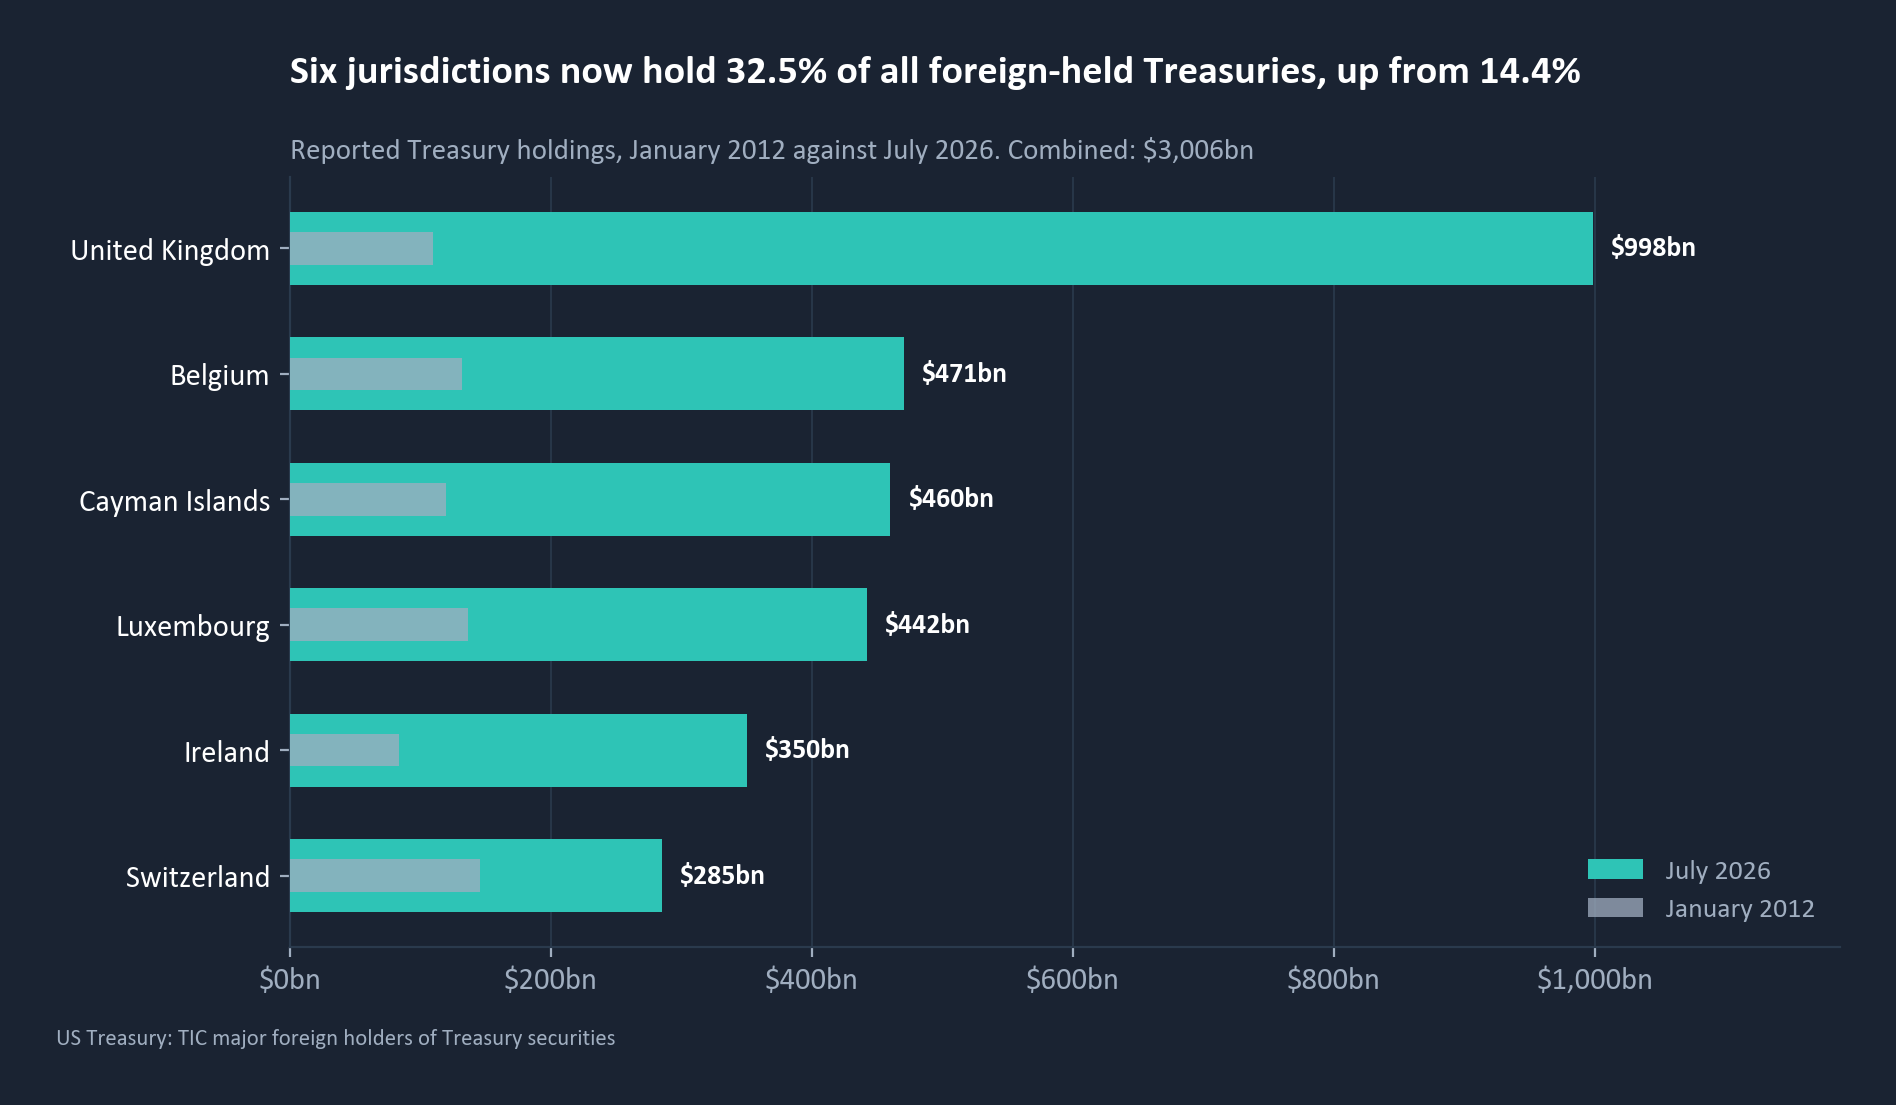
Belgium's own reserves are around $30bn against $471bn of reported Treasury holdings. Luxembourg has a population of roughly 680,000 and $442bn.
This is where the honest version narrows. Those six centres grew by far more than China's holdings fell. Since December 2021 China's reported position is down $422bn while the four comparable European centres are up $663bn. The custodial build cannot all be Chinese, and treating it as though it is overstates the case by a wide margin. Asset managers, hedge funds, insurers and other official holders all custody through the same infrastructure, for the same ordinary reasons.
What is true is narrower and sufficient: the share of foreign Treasury holdings recorded against a jurisdiction that is a custodial address rather than an economy has more than doubled in fourteen years.
Two other governments arrive at the same place by different routes
If this were a Chinese trick it would be a curiosity. It is a direction of travel.
Taiwan. Rather than the central bank buying dollars, which registers as reserves and attracts scrutiny, Taiwan's life insurers hold the currency exposure. The regulator puts insurers' exchange-rate-exposed assets at NT$15.2tn, roughly $483bn. The sector's average hedge ratio fell from 61.5% in March 2025 to 58.55% in October, then past 50% on the prints around the turn of the year, after an accounting change effective 1 January 2026 let insurers spread unrealised currency gains and losses over the life of the instrument. On those published ratios the unhedged portion moved from about $186bn to about $240bn in nine months. That arithmetic is ours, not the regulator's. The direction is the regulator's.
The Gulf. Sovereign wealth funds carry no reserve-transparency obligation. Assets transferred from a central bank to a sovereign fund leave the reserve line and appear in no equivalent series. There is no time series to show, which is the observation.
And within China itself, a second channel. Work by Brad Setser at the Council on Foreign Relations estimates that institutions reporting to China's central government hold closer to $6tn of foreign assets against the $3.12tn officially reported for December 2022, with the difference held mainly through state commercial and policy banks. That is a balance-sheet question, separate from where a bond is custodied. The two stack. They are frequently, and wrongly, quoted as the same number.
What this changes for a portfolio team
Three things, none of which require a view on China.
Carry a band, not a number
Any scenario with an assumption about foreign official demand for Treasuries inherits this measurement problem. The reported foreign official total is $3,773bn. It is a floor. Run the scenario at the floor and again with a custodial band on top, and the difference between the two runs is the exposure the model currently cannot see.
Calibrate to the episode, not to the correlation. The one observed unwind at scale is Belgium in 2014 and 2015: 71% of a position in seventeen months, coincident with a sovereign currency event. That is the right order of magnitude for how fast custodially-routed exposure can move. One episode is a thin basis and should be stated as one.
Check which number your commentary is actually about. A share can fall because the numerator shrinks or because the denominator grows. In this case it is four fifths the second. A house view built on the first is a view about the United States that believes it is a view about China.
What we measured, and what we did not
Measured, from first-party sources. All holdings are from the US Treasury's major foreign holders releases, a 318-month panel from February 2000 to July 2026 across 61 reporting jurisdictions, combining the current release with the historical file. Debt outstanding is from the Monthly Statement of the Public Debt, total marketable. Reserves and gold holdings are from the Chinese administrator's monthly releases and the World Gold Council. Every figure in this piece is derived once and read from a single frozen file.
Handled with care. September 2011 and December 2011 are both Treasury-flagged breaks where the reporting basis changed. Belgium jumps $45bn across the first and the United Kingdom loses $197bn across the second. Neither is a market event. The Cayman Islands is not itemised before January 2012, which is why every multi-jurisdiction comparison here starts there.
Not claimed. We do not know how much of the Belgian and Luxembourg total belongs to China. Nobody outside Beijing does. We have not attributed it, and the argument does not need us to.
Estimated, and flagged as such. The Taiwanese unhedged dollar figures are our arithmetic on a published ratio and a published asset base. The 71% unwind is a single historical episode.
One correction to the original post, while we are here. It values China's 76.7 million ounces of gold at about $400bn and calls it 12% of reserves. At the price on 18 September that holding is worth $336bn, and measured consistently against reserves plus gold it is 8.9%, against 1.8% a decade ago. Still a large move. Most of it is the gold price, which is up 314% over the decade against a 35% increase in ounces held.
If this is useful
Three Horizons Capital builds the data and analytics layer that asset and wealth managers use to construct portfolios, interrogate them, and take them to market. If you would like this run against a portfolio, send us one.
Important information
Important information. Published by Three Horizons Capital for general information and education. It is not investment, legal, tax or accounting advice, not a research recommendation, and not an offer or solicitation to buy or sell anything. It is not a personal recommendation and takes no account of any person's objectives, financial situation or needs. Three Horizons Capital is not a regulated entity. No fund, provider, ticker, manager or issuer is named anywhere in this material; holdings and debt data are cited to the issuing authorities, and third-party research is cited to its published source. Figures were fixed to a single derivation on 20 September 2026, from which the text and every chart read. Past performance is not a guide to future performance, and the behaviour described here may not persist.