Walk into almost any allocator meeting in 2026 and you will hear a version of the same four sentences. Yields are attractive, so add duration. Growth is slowing, so raise cash. US leadership is fading, so rotate abroad. Private markets are where the returns are, so add private equity. Each is coherent. Each is being said by almost everyone at once. When everyone is positioned for the same idea, the idea is already priced, and the return has mostly been collected by the people who got there first.
So this piece does something simple. It puts what allocators are saying next to what the long-run math actually rewards, using a consensus of eight independent capital-market-assumption providers. Where the two agree, the trade is real but crowded. Where they part ways, demand is mispriced, and mispriced demand is the least-competed pipeline a distribution team will find all year.
A word on the data: the "solved" math is a consensus of eight institutional capital-market-assumption providers, recomputed and verified against our live data. The reading is long-run compound return divided by volatility, a structural signal, not a trading ratio. The "said" side comes from our own advisor-commentary and flow-decomposition models. This is distribution-strategy research, not investment advice; asset classes are examples, not recommendations.
01 · What allocators say
The consensus script, and why its uniformity is the risk.
Four themes dominate the conversation. The Fixed Income Renaissance (35.5% of advisors) lengthens duration into a trade the math partly supports but the crowd already owns. De-risking (23.1%) raises cash and short Treasuries, which carry some of the lowest long-run readings in the universe. Diversify away from US equities (14.9%) is a fine story, but our flow data shows capital still arriving into US equity. And private markets as the return source (5 to 9%) is the right idea pointed at the wrong vehicle.
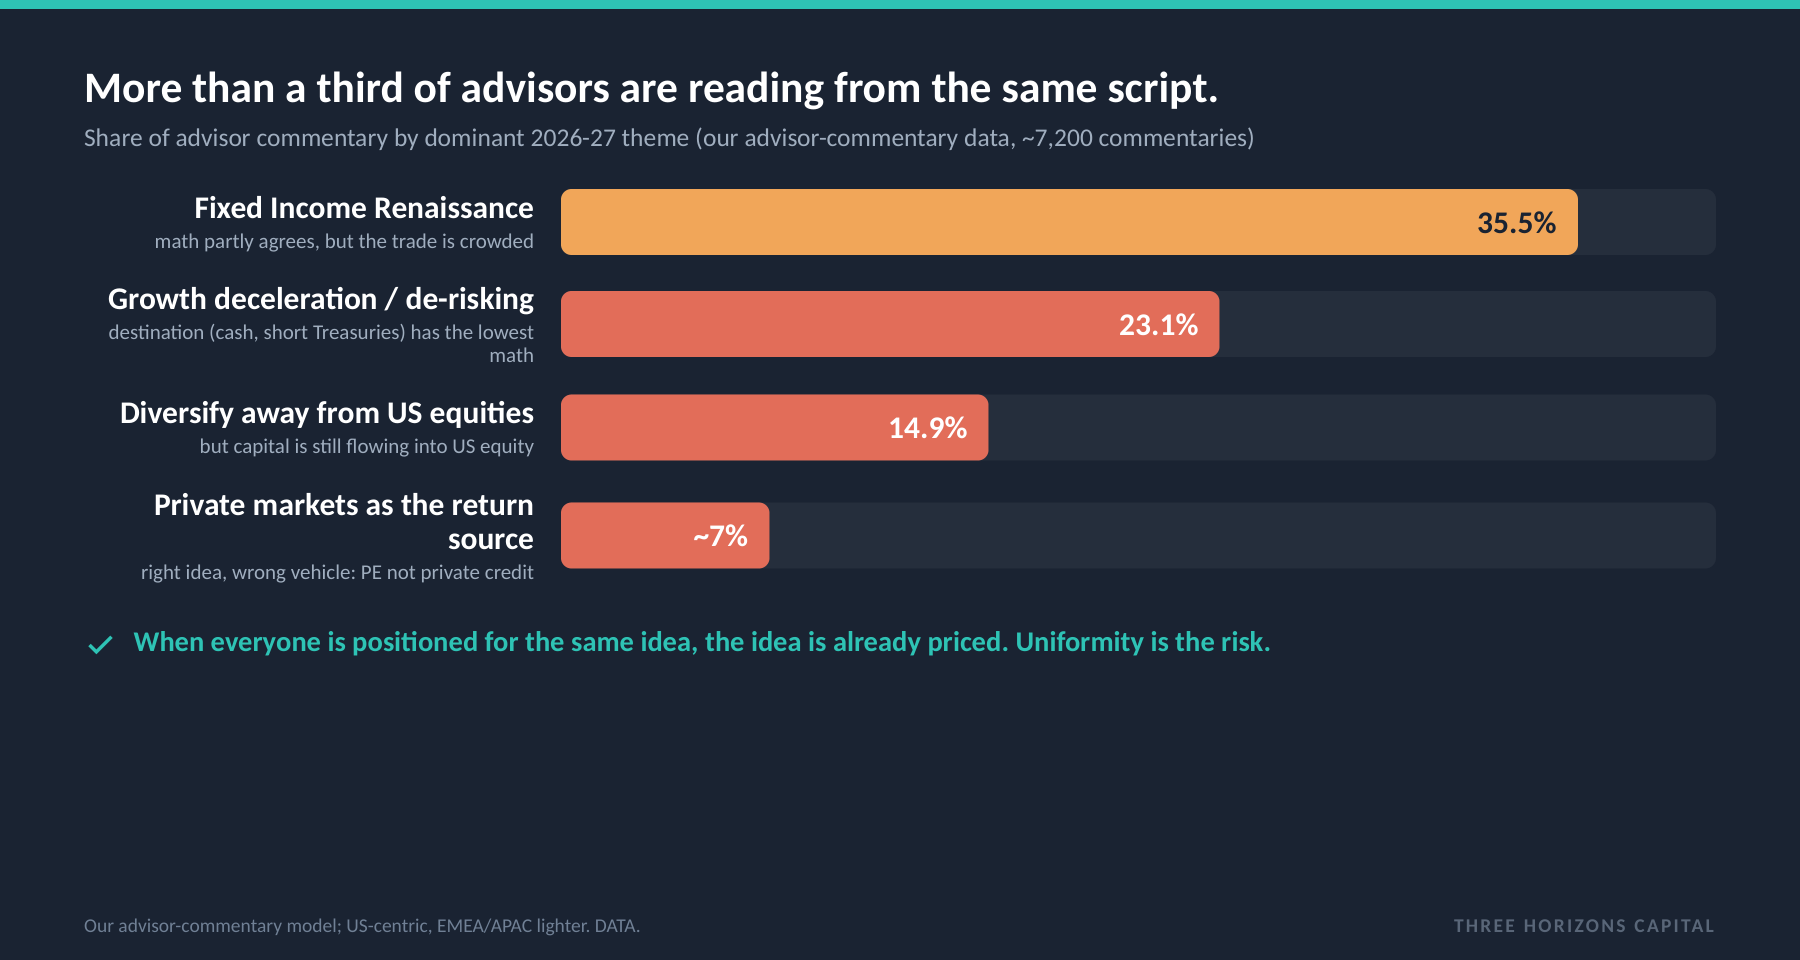
What this tells you: These four are coherent and well argued. They are also the trailing edge of positioning, not the leading edge of returns. The edge in institutional sales is not finding the loudest narrative. It is finding the next one before it becomes consensus.
02 · What the math says
The loudest trades carry the weakest math.
We read a single number we call the Structural Return-to-Risk Ratio: an unweighted geometric mean, across the eight providers, of each provider's ten-year compound return divided by its volatility forecast, standardised to USD, with strategy definitions mapped to uniform benchmarks. We deliberately omit the risk-free rate, because we are measuring the raw structural efficiency of each asset class over a ten-year horizon, independent of macro cyclicality or central-bank policy, not a trading Sharpe ratio. Lay the loudest narratives over it and a pattern appears: the assets allocators talk about most carry the weakest math, and the strongest readings belong to assets almost no one is pitching.
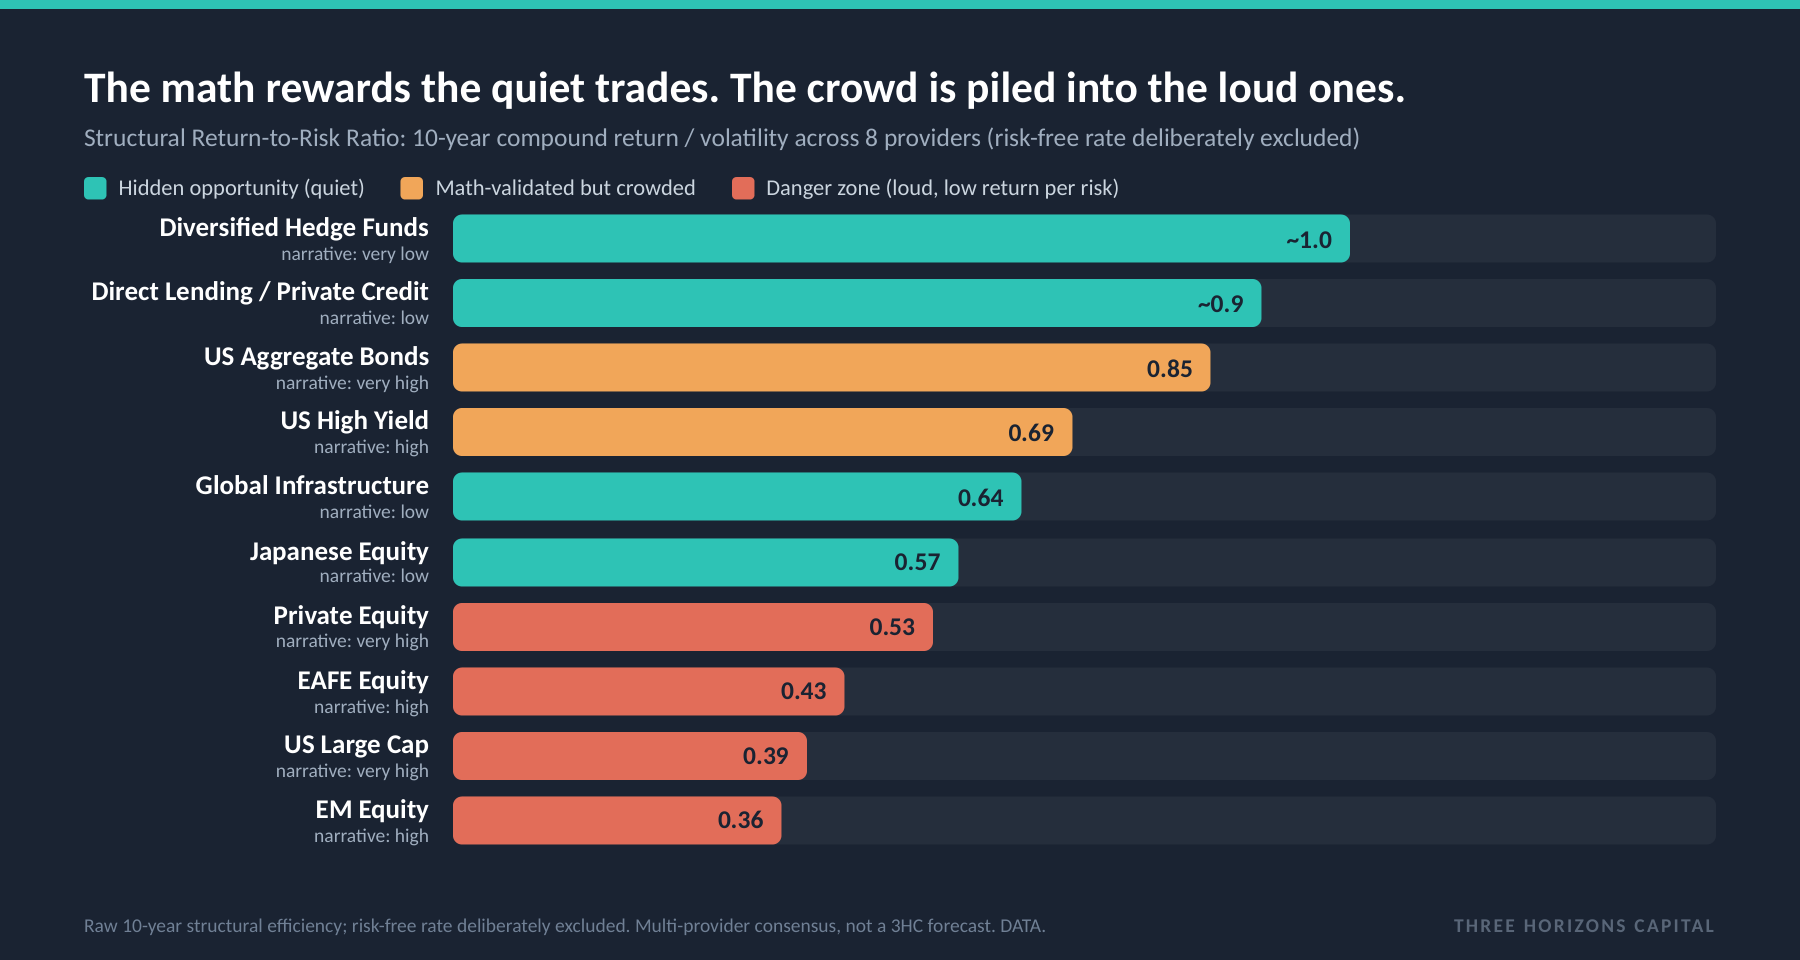
The crowd is concentrated in the danger zone: private equity reads about 0.53, US large cap about 0.39, broad EAFE and emerging-market equity 0.43 and 0.36. The opportunities are quiet: direct hedge funds read around 1.0 and direct lending around 0.9 (roughly 1.7 times private equity, and double at its strongest provider reads), global infrastructure 0.64 with contracted inflation-linked cash flows, and Japanese equity reaches 0.57 at its strongest provider read while advisor commentary on it stays far below the noise. Richly valued is not the same as rewarding.
03 · The clearest mismatch
The crowd buys private equity. The math favours private credit.
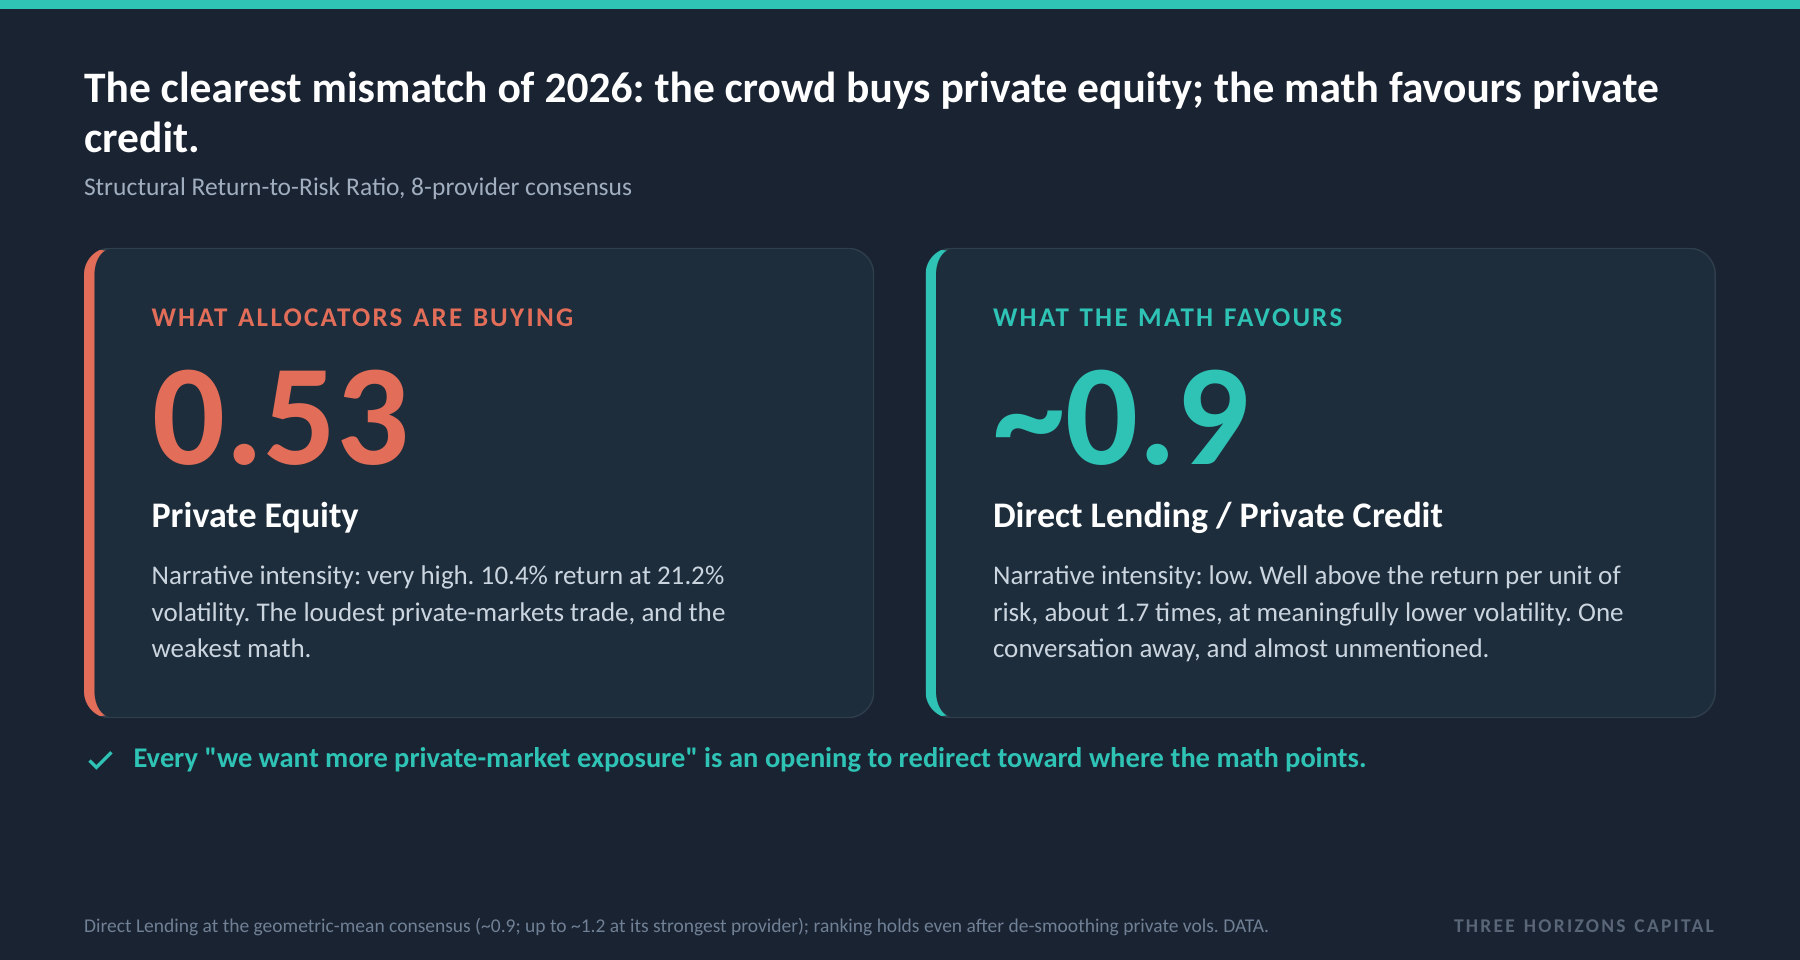
Allocators are piling into private equity at exactly the moment eight providers show its risk-adjusted return compressed, while the part of private markets the math actually favours, direct lending, sits one conversation away and almost unmentioned. Every meeting that opens with "we want more private-market exposure" is an opening to redirect toward where the math, not the narrative, points.
What this tells you: On the obvious objection: private-market volatilities here follow standard institutional reporting, which smooths quarterly appraisals. Even after de-smoothing, direct lending typically retains a structurally superior return-to-risk profile over private equity across the eight-provider consensus, because its return is shorter-duration and senior, income-driven cash flow rather than leveraged and equity-like. The ranking survives the adjustment.
04 · Where narrative and capital part ways
Saying and doing are different signals. The gap is where timing lives.
Our flow model separates observed exposure into structural, narrative and idiosyncratic components. Three divergences are commercially actionable now. In the United States, the technology narrative runs at roughly 46% of the US-equity maximum but actual flows sit near 10%, a window to reach advisors while the narrative is still forming. In Europe, investors discuss rotating home yet capital keeps flowing into US equity, and European domestic equity shows a negative narrative signal despite positive long-run math, a twelve to eighteen month window. In Asia Pacific, the Hong Kong technology narrative is deeply negative while actual flows are strongly positive, a contrarian confirmation that sophisticated allocators are buying against the story.
05 · The playbook
Point the engine at durable demand.
The conclusion is not a market call, it is a redirection of effort. The goal is not a permanent home in private credit, because the quiet trade becomes a loud one once everyone arrives; the goal is a repeatable engine that captures the alpha of quiet pipelines before they compress into the next consensus script. Map every strategy on the grid of narrative intensity against long-run math: loud-but-weak needs a defensive brief, quiet-but-strong needs pipeline now. Reframe private-equity conversations toward private credit, with the eight-provider math doing the persuading. And carry a regional said-versus-solved brief, a one-page picture of where narrative and capital are misaligned in each geography. Run it every quarter, not once.
The honest part: we deliberately omit the risk-free rate, because we are measuring the raw structural efficiency of each asset class over a ten-year horizon, independent of macro cyclicality or central-bank policy, not a trading Sharpe ratio. It is a long-run signal, not a forecast. Direct lending is shown at the verified geometric-mean consensus, around 0.9, comfortably above private equity rather than the most optimistic single number. And our advisor-commentary coverage is strongest in the US, lighter in Europe and Asia, and not yet available for Latin America. We would rather name the gap than imply a coverage we do not have.
Sources: Three Horizons Capital consensus of eight long-term capital market assumption providers (2025 to 2026 vintage, USD, 10-year horizon), recomputed and verified against our live data; the structural return-to-risk reading is long-run compound return divided by volatility and does not subtract a risk-free rate. Advisor-commentary theme shares and narrative-flow divergences are our own models (roughly 7,200 commentaries; US-centric). LTCMA figures are multi-provider consensus estimates, not Three Horizons forecasts; we are not affiliated with the providers. For research and platform-demonstration purposes; not investment advice. Asset classes are examples, not recommendations.