In 2026 the money is not going where the commentary says it should. Read the memos and you arrive at the mandate late. Read the flows and you arrive early. What follows is a map of where public and private capital is actually moving this year, who is moving it, and what it tells an asset manager about where to spend the next call, the next product, and the next dollar of distribution budget.
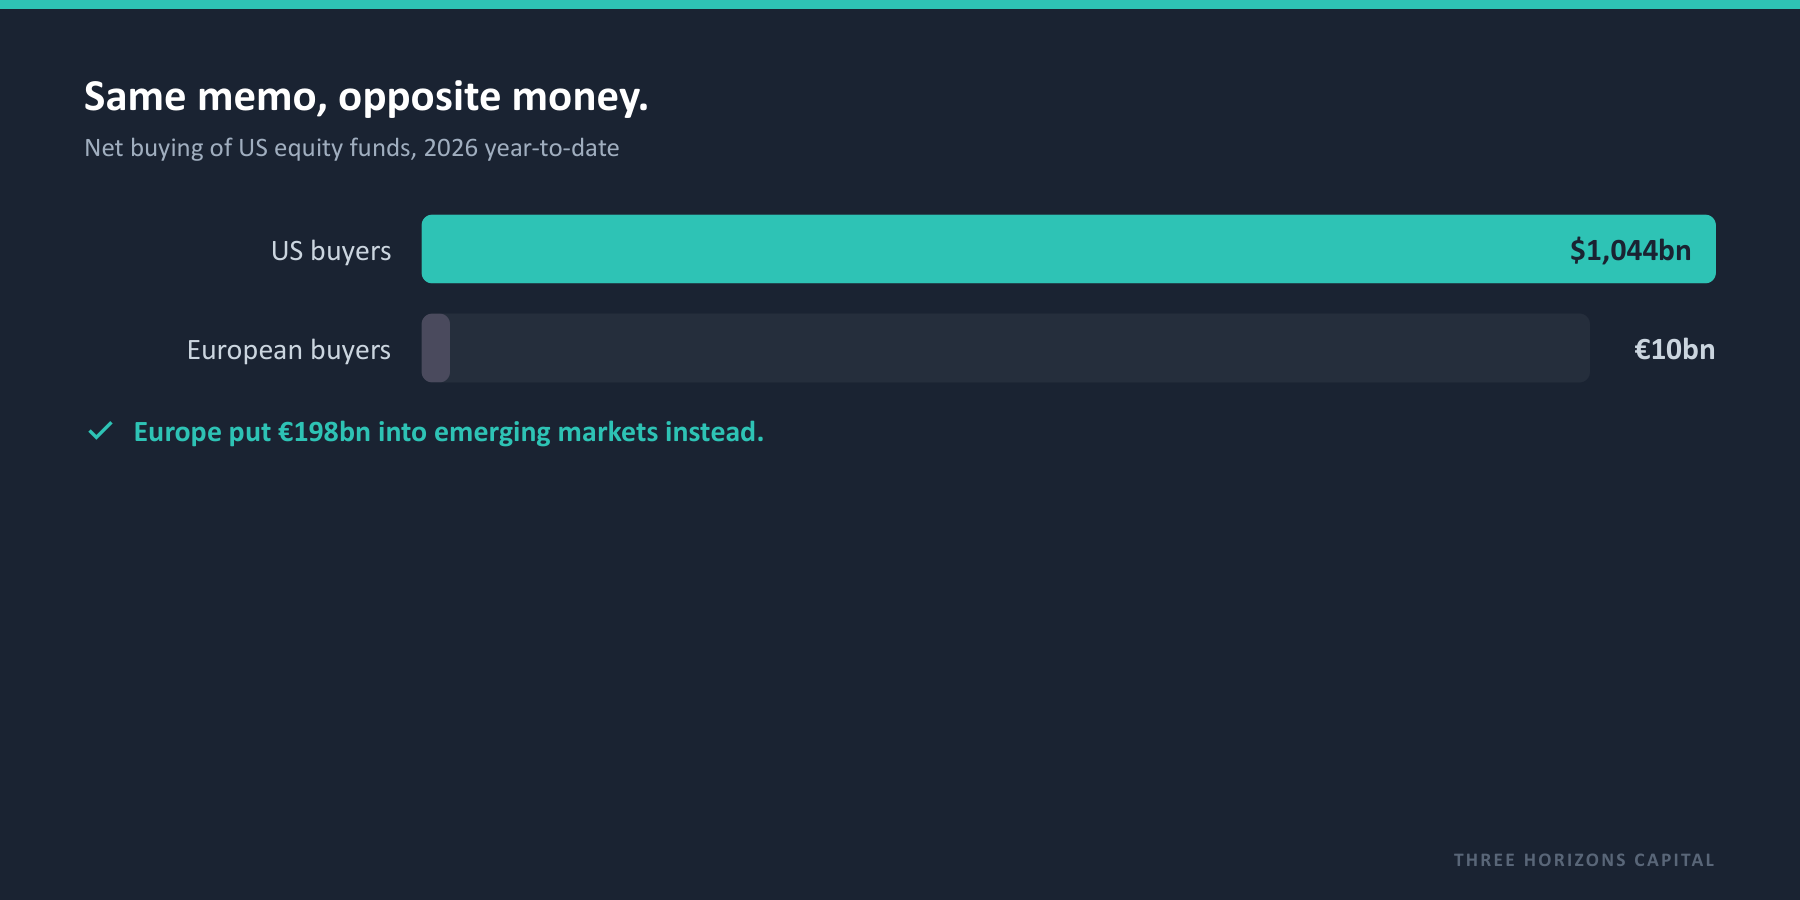
What this tells you: US buyers have put about $1.04 trillion into US equity funds so far this year. European buyers have put roughly €10 billion into US equity, and €198 billion into emerging markets. Same headline. Opposite behaviour. The gap between what allocators say and where their money goes is the most reliable signal of where the next mandate sits.
A word on the data: we track public fund flows globally, every week, and separate each move into the part that is a lasting reposition and the part that is chasing the week's headline. We read those flows alongside private-markets commitments in the same view. Public figures are 2026 year-to-date through early June; private-markets figures are the latest reported full-year data and are labelled as such.
01 · Public markets
The headline is US equity. The money to chase is underneath it.
The loudest number is the least useful. US equity took in around $1.04 trillion year-to-date, and every competitor's deck already says so. The exposures that tell you where to point product are the quieter ones beneath it.
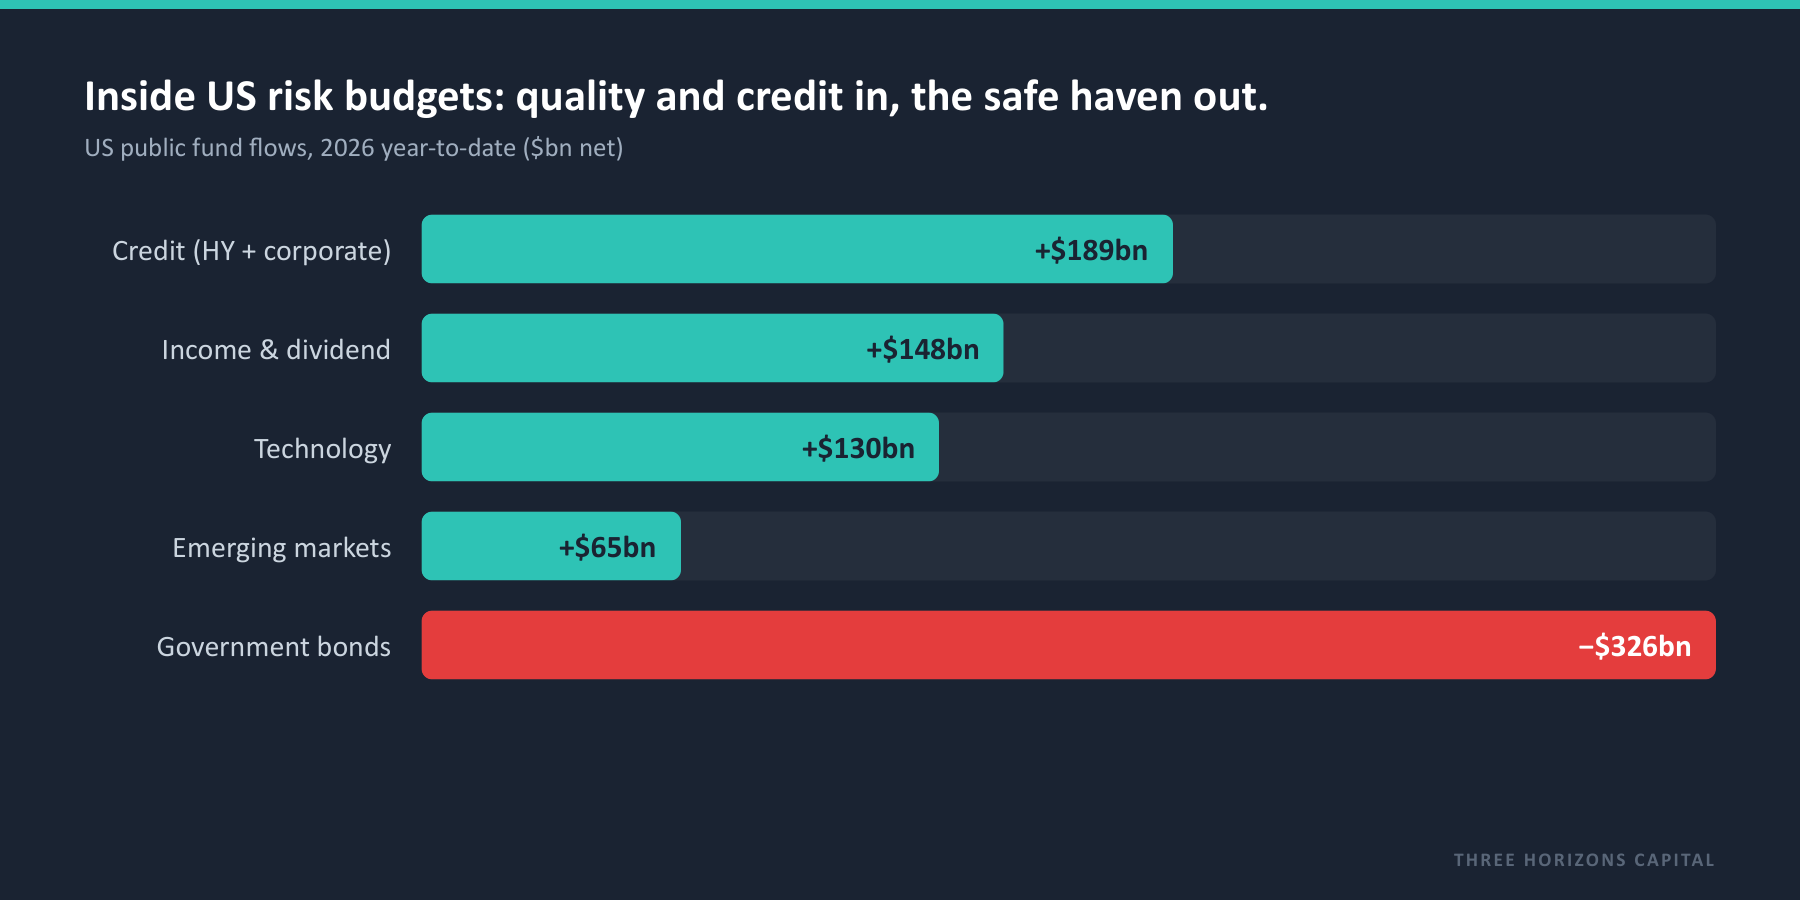
In the US, the money is tilting to quality, yield and credit, and selling the old safe haven: income and dividend equity +$148bn, credit +$189bn, technology +$130bn, emerging markets +$65bn, while pulling about $326bn out of government bonds. Allocators are reaching for income and quality inside their risk budget, and they have stopped treating Treasuries as the reflexive hedge.
In Europe, allocators are doing what Americans only talk about: roughly €198bn into emerging-market equity, €104bn into their own region, and only about €10bn into US equity. If you sell a non-US or EM strategy, the European pool is where the money is actually moving. In Asia, the access hubs are the mirror: Hong Kong added around $40bn to US equity. Still net buyers of the US trade.
What this tells you: There is not one global rotation to sell into. There are at least three, pointing in different directions. Bring the EM or European strategy to the European and Asian pools; bring income, quality and credit to the US pool; and do not waste a US-diversification pitch on a US allocator whose money says otherwise.
02 · Private markets
The winner is liquidity itself.
In private markets the story is not which strategy is hottest. It is that capital has been committed faster than it can come back, and the whole market is reorganising around getting cash out. A record $2.1 trillion of dry powder sits uncalled. Managers raised about $1.1 trillion, yet realised only $468bn of exits. Holding periods have stretched to 6.1 years and purchase prices remain full (around 12.1x EBITDA in Europe, 11.9x in North America).
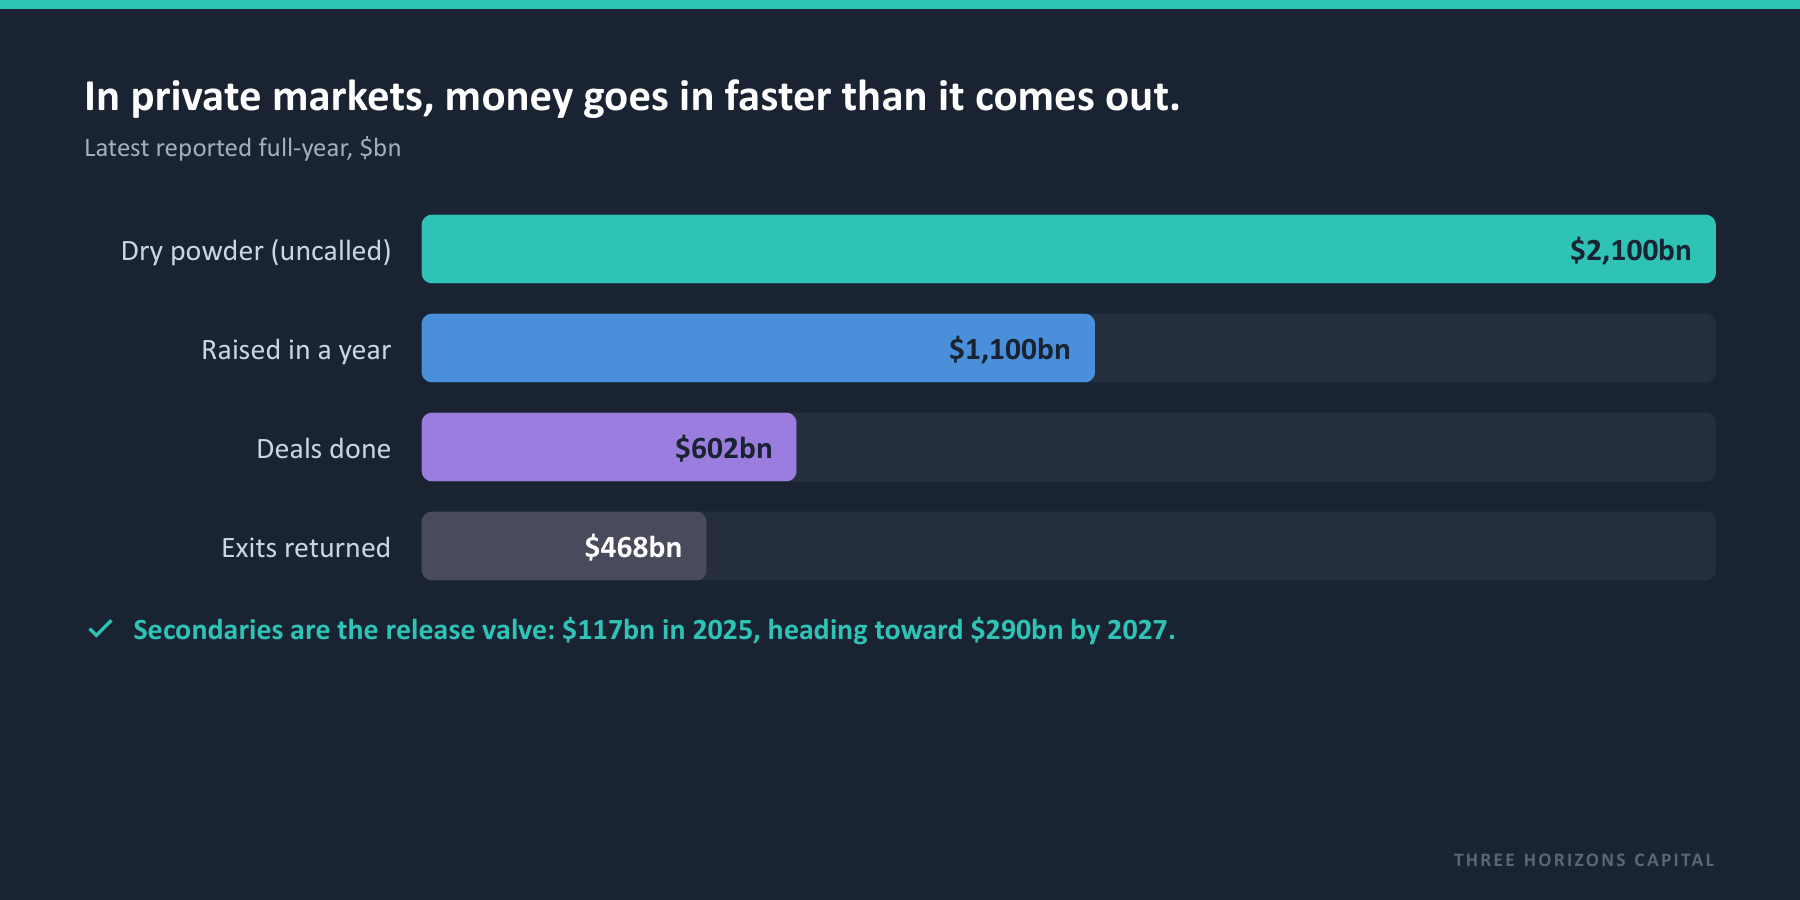
So the live, fundable need is liquidity. The secondary market has gone from a last resort to the primary tool: volume reached about $117bn and is projected toward $290bn by 2027. Where private capital is being won right now is in the vehicles that solve the cash problem: secondaries, continuation funds, evergreen and semi-liquid structures, and private credit, with demand broadening from the big institutions down into wealth.
What this tells you: A fund that offers genuine liquidity, a secondaries sleeve or an evergreen wrapper is selling into the strongest current in private markets. Another ten-year drawdown vehicle is selling into the weakest.
03 · Said versus done
The gap is the signal, and it is regional.
The distance between what allocators say and what they do is not noise. It is a timing edge, and it differs by region and by asset class. In public markets the say-do gap is widest in the US: allocators say cut concentration, then deliver the largest US-equity inflow in the world. Europe is the mirror image, where words and money agree. So an EM or international strategy is an evidence-backed conversation in Europe and an uphill one in the US, whatever the committee says.
In private markets the gap is conviction versus cash: allocators report record commitment, while their intent to sell on the secondary market now runs ahead of their intent to buy, and about a third intend to change allocations. Committed on paper, heading for the door in practice.
What this tells you: The gap is the appointment. Reach the European allocator whose flows already back your non-US story, the US allocator whose own actions you can show them, and the LP who needs liquidity before they admit it. Early is revenue; late is a meeting.
04 · The regulator's hand
A green light in some regions, a handbrake in others.
Regulation decides how fast the money can actually move, and in 2026 it pulls in opposite directions by region. This is where go-to-market budget earns its highest return: deploy where the rules are opening the gate.
EU: wide open
ELTIF 2.0 has unlocked private markets for the wealth channel: around 189 new vehicles in two years, roughly half evergreen or semi-liquid. The fastest-opening door in the world for an evergreen private strategy.
US: the biggest pool unlocked
A 2025 executive order and a 2026 Department of Labor rule are opening defined-contribution and 401(k) plans to private markets, with evergreen funds as the vehicle. A multi-year tailwind.
UK: pushing, with a brake
The Mansion House Accord commits DC schemes to at least 10% in private markets by 2030, and the LTAF gives them the vehicle. Post-crisis liquidity discipline slows the pace.
Lat Am: the handbrake
Chile’s pension reform caps the total underlying fees a fund can bear, including foreign-fund fees, from late 2026. The premium offshore pitch gets harder; the lower-cost, intra-regional story works.
05 · What this means
We hand you the target, the timing, and the conversation.
Public money is tilting to income, quality, credit and emerging markets, with Europe genuinely diversifying and the US only saying it will. Private money is chasing liquidity, and regulation is widening the wealth and retirement channels fastest in Europe and the US. The most valuable thing in all of it is the distance between what allocators say and what they do, because that distance is where the mandate is before it is obvious.
That is exactly what we are built to show. We bring public flows, private-markets data and allocator intelligence into one view, and hand a manager three things: a target (which pools are actually moving toward your strategy, by region), a timing (which flows are sticky and which are about to reverse), and a conversation (the allocator's own real-versus-stated position, with the numbers). The difference between a market call and a sales meeting, at variable cost instead of the fixed cost of building the data estate yourself.
One honest note. Public-flow figures are 2026 year-to-date through early June; private-markets figures are the latest reported full-year data and move more slowly. Flows can reverse when the headline that drove them resolves, which is precisely why we separate the structural money from the tactical.
Sources: Three Horizons Capital daily public fund-flow data and private-markets monitor (figures window-labelled above); regulatory detail from ELTIF 2.0 and EU fund data, US Department of Labor / SEC, the UK Mansion House Accord and FCA LTAF regime, and Chile's pension reform. For platform demonstration and research purposes; not investment advice.