Private markets
Price the Pipeline, Then Prove the Platform
Family offices are writing direct cheques into AI-driven biotech, and the pitch leads with the algorithm. This note sets out how to value such a company: price the drug pipeline against what the listed market already pays, credit the AI platform only where its evidence meets the risk still ahead, and carry the jobs a fund manager would otherwise do.
Three Horizons Capital · 14 September 2026 · Listed company figures as at 11 September 2026 on the latest reported quarter, in US dollars. Private offering notices to 2026 Q2. Fund flows to June 2026. The worked example is illustrative. For professional investors only; this note is not investment advice. No company, fund, family office, manager or individual is named anywhere in this note.
19.6%
of listed US biotechnology companies valued under $300m are priced at or below the cash on their balance sheet
6.9 quarters
median cash runway of listed biotechnology companies that are burning cash, where two independent data vendors agree
11 of 570
listed biotechnology companies whose own business description puts AI or data science at the centre of discovery
The finding in one line
Price the pipeline against what the listed market already pays. Pay for the platform where its evidence meets the risk still ahead, and today that evidence sits at the stage where an improvement is worth least.
Family offices are writing direct cheques into AI-driven biotech, and pricing them without a fund manager
Press coverage this month described family offices writing direct cheques into biotechnology start-ups, with AI-driven drug discovery as the stated thesis. The count behind that coverage belongs to a third party and we have not re-derived it. What we can measure is the market those cheques are entering, and it has two sides.
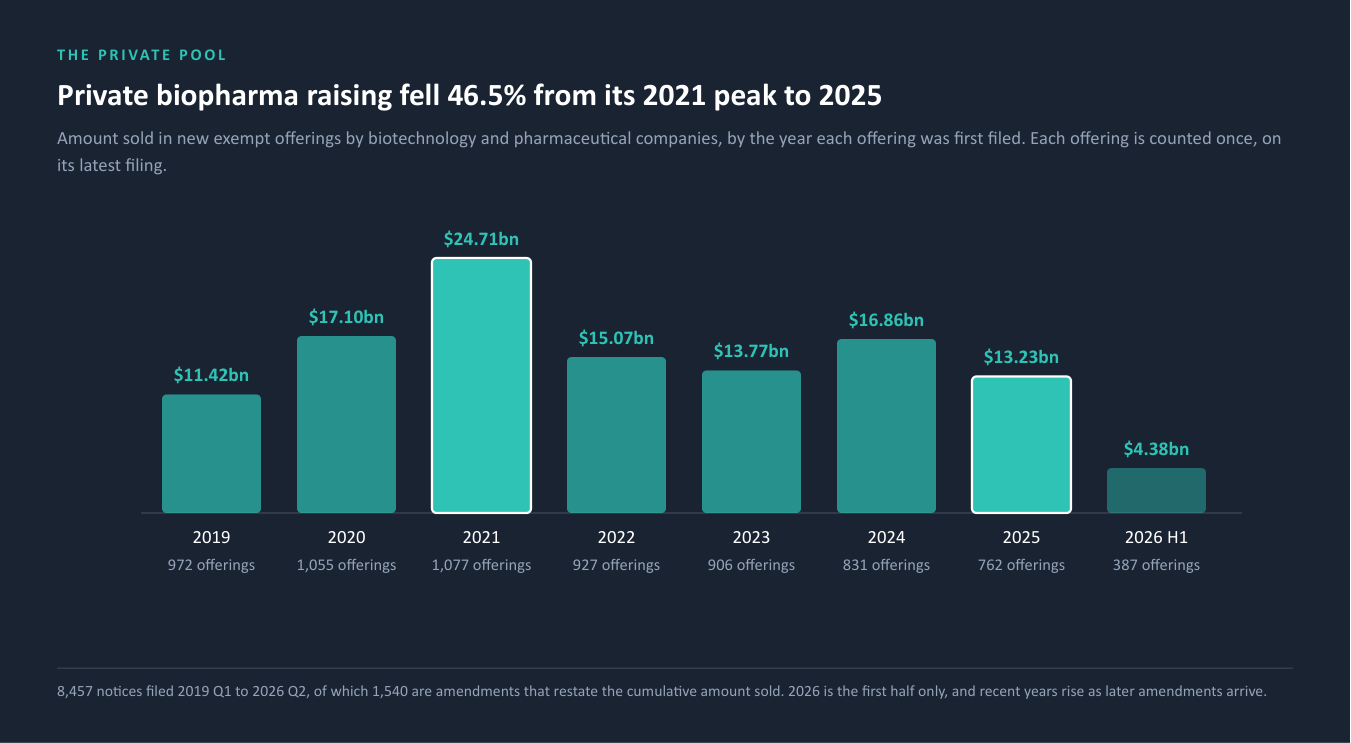
The private pool is smaller than it was. OURS Biotechnology and pharmaceutical companies filed 1,077 new exempt-offering notices in 2021, reporting $24.71bn sold. In 2025 they filed 762, reporting $13.23bn: 29.2% fewer offerings and 46.5% less money. The first half of 2026 brought 387 offerings and $4.38bn. We count each offering once, on its latest filing, because amendments restate the cumulative amount sold, and adding them up would overstate the total.
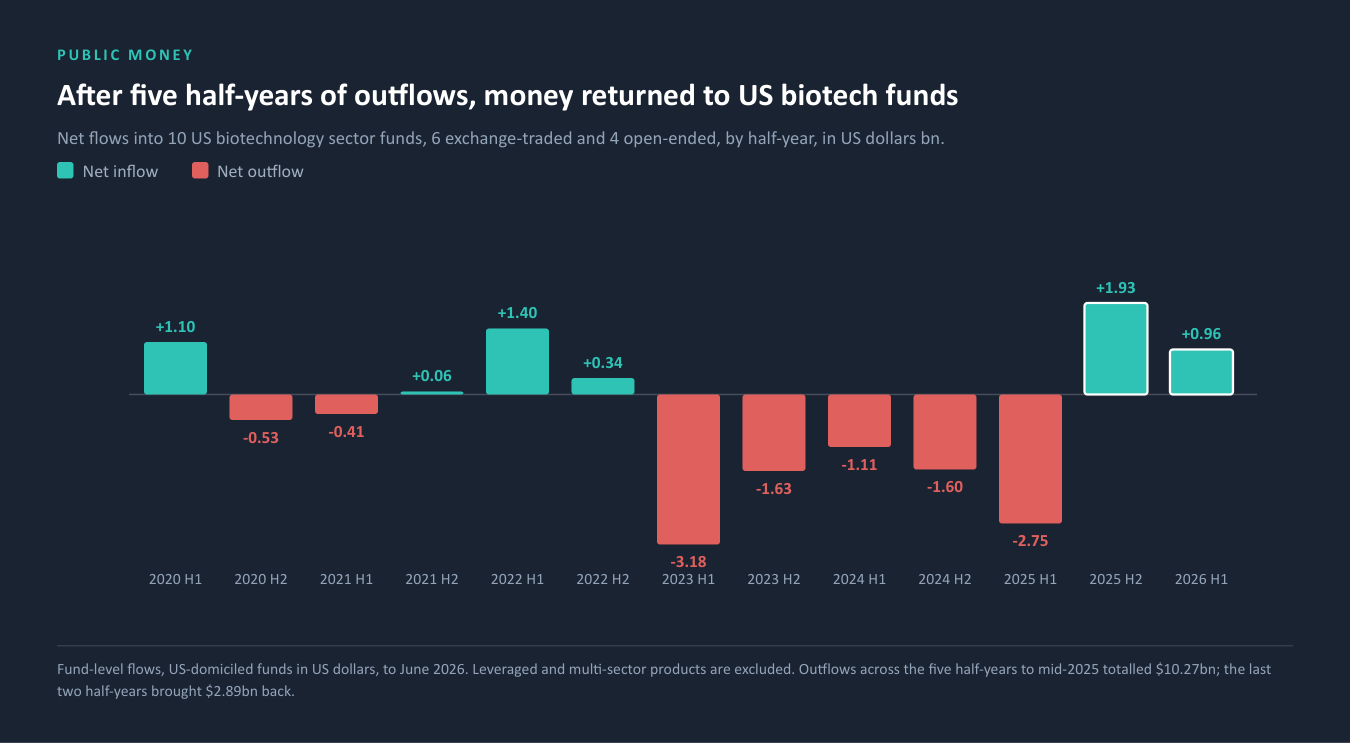
Public money has turned back towards the sector. OURS Ten US biotechnology sector funds, six exchange-traded and four open-ended, lost $10.27bn to net outflows across five consecutive half-years to mid-2025. In the second half of 2025 they took in $1.93bn, and in the first half of 2026 a further $0.96bn.
For a family office writing a direct cheque, that combination means two things. Interest in good companies is returning, so price discipline matters again. And in a direct deal the price is agreed without a specialist fund manager in the room to push back on it.
WHAT THIS MEANS FOR A FAMILY OFFICE
The question is not whether AI-driven biotech deserves attention. It is how to price a cheque when the company leads with an algorithm nobody at the table can verify, and what the family carries once the cheque is written.
An AI-driven biotech is two businesses sharing one balance sheet
The first discipline is separation.
A drug pipeline. Molecules in development, each with a probability of surviving the next trial, a cost to get there and a market if it does. This business is valued the way every biotech is valued, and how the molecules were found does not change the arithmetic.
A discovery platform. Models, data and automation that the company expects to find better molecules, faster or more cheaply, in future. This business is a claim about pipelines that do not yet exist.
The common mistake is to let one multiple do both jobs. The pipeline's value already reflects the molecules the platform produced. Paying a platform premium on top of it pays twice, unless the platform will go on producing more or better molecules than an ordinary laboratory would.
The rest of this note works through six steps, each marked by whether independent data can verify it.
| Step | The question | Can independent data verify it? |
|---|---|---|
| 0. Deal shape | What am I buying, and alongside whom? | Partly: the sponsor's record, where there is one |
| 1. Price the pipeline | What is the drug business worth with the AI story removed? | The industry base rates, yes. The company's plan, no |
| 2. Anchor to the listed market | What does a public investor pay for a pipeline today? | Yes |
| 3. Credit the platform | Where does the evidence sit, and does the remaining risk sit there too? | The evidence base, yes. The algorithm itself, no |
| 4. Test the price | Does the round price sit inside what steps 1 to 3 support? | Partly |
| 5. Carry what a fund would carry | Can the family fund the next round, mark the stake and afford to lose it? | Yes |
Step 0 comes first because the deal shape changes every step after it. A direct cheque puts all six steps on the family office. A co-investment alongside a specialist sponsor lets the family lean on the sponsor's diligence for steps 1 and 3, but not on the sponsor's price, because the sponsor may be averaging a higher entry across its fund. A fund commitment hands steps 1 to 4 to the manager and leaves the family with step 5 and the choice of manager. Decide which of the three this is before the pitch deck is opened.
The pipeline is priced by attrition, and Phase 2 decides most of the value
A risk-adjusted valuation of a drug programme weighs every future cash flow by the probability of reaching the year it arrives, and every cost by the probability of reaching the phase that incurs it, then discounts the result at the investor's required return. The arithmetic is standard. The inputs that matter most are the odds.
The most recent industry analysis of phase transitions, covering 2014 to 2023 and cited in full in section 09, puts the likelihood that a drug entering Phase 1 is eventually approved at 6.7%. EXTERNAL A programme passes Phase 1 47% of the time, Phase 2 28% of the time, Phase 3 55% of the time, and moves from filing to approval 92% of the time. Multiply the four and you arrive at the 6.7%.
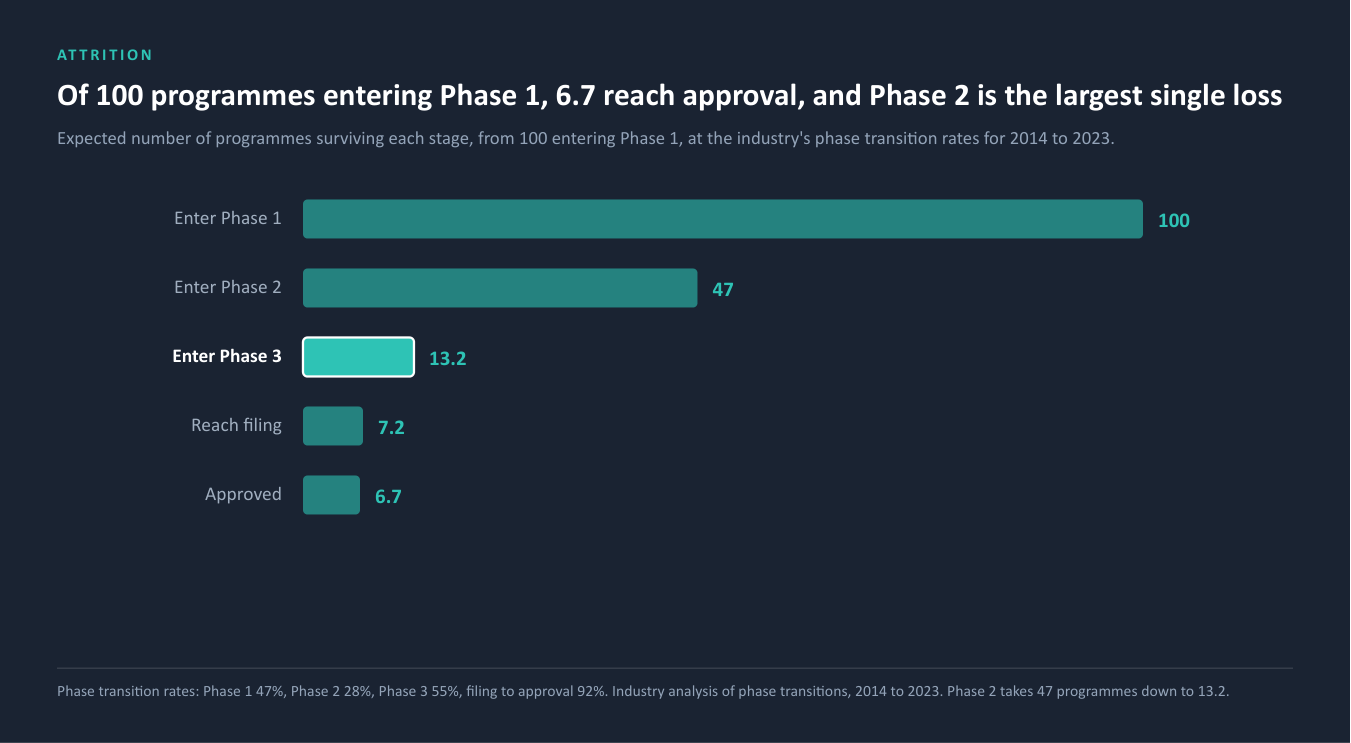
Two things follow. Phase 2 is the largest single loss: of every 47 programmes that enter it, 13.2 come out. And the odds have drifted lower: an earlier industry study of 12,728 phase transitions between 2011 and 2020 put the same likelihood at 7.9%. EXTERNAL The two windows overlap, so the comparison shows direction rather than a precise change.
A worked example. JUDGEMENT Consider an illustrative company, Company A. It has one programme about to enter Phase 2 and one about to enter Phase 1, $150m of net cash, and corporate costs of $25m a year for four years. Each programme costs $20m over two years in Phase 1, $50m over two years in Phase 2, $150m over three years in Phase 3 and $5m to file, and earns $300m a year for ten years if approved. We discount at 12.0%, the top of the range of long-term venture capital return assumptions published by three houses for 2026.
At industry odds, the programme about to enter Phase 2 is worth $52.4m. The programme about to enter Phase 1 is worth slightly less than nothing, at minus $0.4m. After $85.0m of corporate costs in present value and $150m of net cash, Company A is worth $116.9m.
The example is deliberately simple, and anyone who builds these models will see where. Revenue is flat for ten years rather than rising to a peak and falling at patent expiry, and one discount rate applies to every phase rather than a higher rate for earlier, riskier stages. Both simplifications are stated so a committee can replace them with its own.
The early programme is the useful lesson. At industry odds and a venture hurdle, a programme about to enter Phase 1 is worth roughly nothing on its own. Almost all of its value is the option to learn more.
WHAT THIS MEANS FOR A FAMILY OFFICE
Most of the value in a biotech round is the probability that its lead programme survives Phase 2. A valuation that does not show that probability explicitly has buried the largest assumption in the deal.
The listed market already prices pipelines, and a fifth of small listed biotechs trade at or below their cash
A family office asked to pay a private price can see what a public investor pays today for a comparable pipeline, with daily liquidity and full disclosure. We measured it across the whole listed market. OURS
The universe is 570 US-listed, actively trading biotechnology companies. For each one we take market value on 11 September 2026 and subtract net cash from the latest reported balance sheet. What remains is what the market pays for everything else, which for a clinical-stage company is mostly the pipeline.
We checked every figure against a second, independent data vendor, and the check changed what we publish. Across 463 companies reporting in US dollars, the two vendors used the same balance-sheet quarter 97.6% of the time and agreed on net cash, to within a tenth of market value, 89.4% of the time. They agreed on market value itself, to within 5%, only 57.5% of the time, with the gaps concentrated among small companies and depositary receipts. The test we set before running the numbers required agreement on which side of cash a company sits for 95% of companies. It reached 93.5% and did not pass. We therefore publish the valuation figures only for the 243 companies on which both vendors agree, and show the single-vendor figures for all 556 valued companies alongside. The picture is the same on either basis.
| How the listed market prices a pipeline | Both vendors agree: 243 companies | Single vendor: 556 companies |
|---|---|---|
| Priced at or below cash | 8.2% | 11.9% |
| Of companies valued under $300m, priced at or below cash | 19.6% | 22.6% |
| Median share of market value priced for the pipeline | 79.6% | 74.3% |
| Burning cash over the last four quarters | 78.6% | 85.3% |
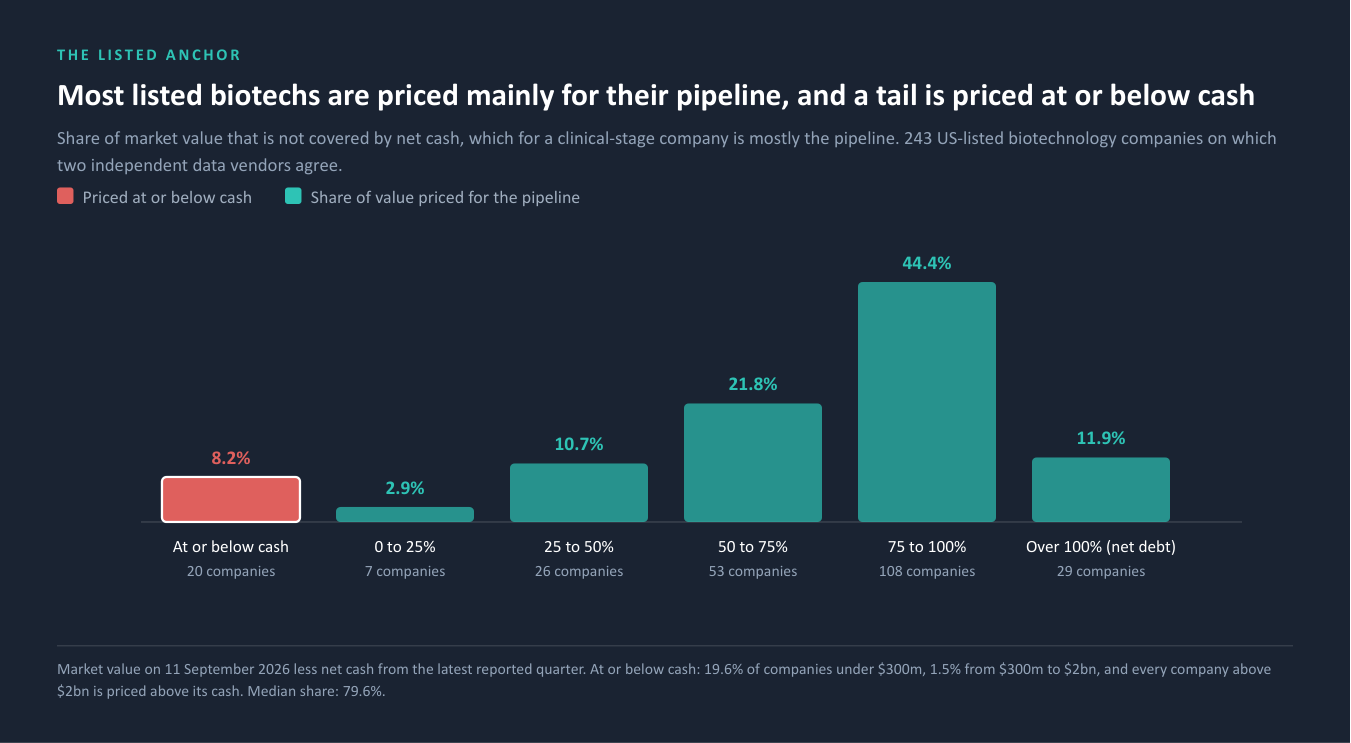
Size decides it. Among companies valued under $300m, 19.6% are priced at or below their cash. From $300m to $2bn the figure is 1.5%. Every one of the 78 companies valued above $2bn is priced above its cash.
Most listed biotechs are funding their pipeline against a clock. Runway is the tightest test of agreement, because it depends on both cash and burn, so we publish it for the 95 companies on which both vendors agree within a quarter, alongside the 474 cash-burning companies on the single-vendor basis.
| Cash runway at the current rate of burn | Both vendors agree: 95 companies | Single vendor: 474 companies |
|---|---|---|
| Median runway | 6.9 quarters | 6.6 quarters |
| Less than four quarters | 29.5% | 31.0% |
| Less than eight quarters | 56.8% | 57.6% |
The anchor is a reference, not a verdict, in either direction. A listed price at or below cash is not proof that the market values a pipeline at nothing. Small listed companies can trade there for reasons that have little to do with the science: thin trading, the expectation of dilution when cash runs low, doubts about how the cash will be spent, or holders who have to sell. Going the other way, a private round can buy things a listed share does not: a liquidation preference that returns capital first, information rights, and often a board seat. Those rights have value, and they belong in the price rather than in the negotiation alone.
WHAT THIS MEANS FOR A FAMILY OFFICE
A private round should be explainable against this distribution, after adjusting for what each side buys. A private company asking for a large premium over its own cash needs a reason that survives the comparison with listed companies priced near theirs, and the rights in the round should be worth at least the liquidity the family gives up.
How many listed biotechs are AI-driven by their own account? OURS We read the business description of every company in the universe, flagged 60 candidates with a keyword search, and reviewed each one against a single rule: AI, machine learning or data science must be described as central to how the company discovers or develops its drug candidates. 11 of 570 qualified, 1.9%. Of the 49 rejected, 37 had matched on unrelated words; the rest used AI as one tool among several, attributed it to a partner, were exploring it, or run a different kind of business. This measures what companies say is central, which is a far narrower question than whether a company uses AI somewhere. Six of the 11 sit in the set on which both vendors agree, which is too few to compare their pricing with the rest of the market, so we have not.
AI's proven edge sits at the stage where an improvement is worth least, so price the platform on what it produces next
The evidence for AI in drug discovery is real, and it is worth stating precisely. A 2024 analysis of the clinical pipelines of AI-native biotechnology companies found that AI-discovered molecules succeeded in Phase 1 80 to 90% of the time, which its authors describe as substantially higher than historic industry averages. EXTERNAL In Phase 2 the rate was about 40%, which the authors judge comparable to historic averages, on a limited sample. The capability that shows up is the design of molecules with drug-like properties, and Phase 1 is where that is tested.
The sample deserves one concession. It draws on the disclosed pipelines of AI-native companies, which means molecules that reached the clinic and were made public, so the true rate across everything these platforms produce may be lower. Our argument does not need the figure to be high. It needs only to know where the evidence sits.
We have not set those figures beside the industry rates in section 03. The two sources may not define success the same way, and a reader lining up the two Phase 2 figures would draw a conclusion the authors themselves do not draw.
Now ask what an improvement is worth, and where. JUDGEMENT Take the illustrative programme from section 03 at three points in its life, and give it a platform that raises its chance of success at the stage it is about to enter by a quarter.
| Programme about to enter | Value at industry odds | Value added by a quarter better chance at that stage |
|---|---|---|
| Phase 1 | minus $0.4m | $4.9m |
| Phase 2 | $52.4m | $25.6m |
| Phase 3 | $458.5m | $152.1m |
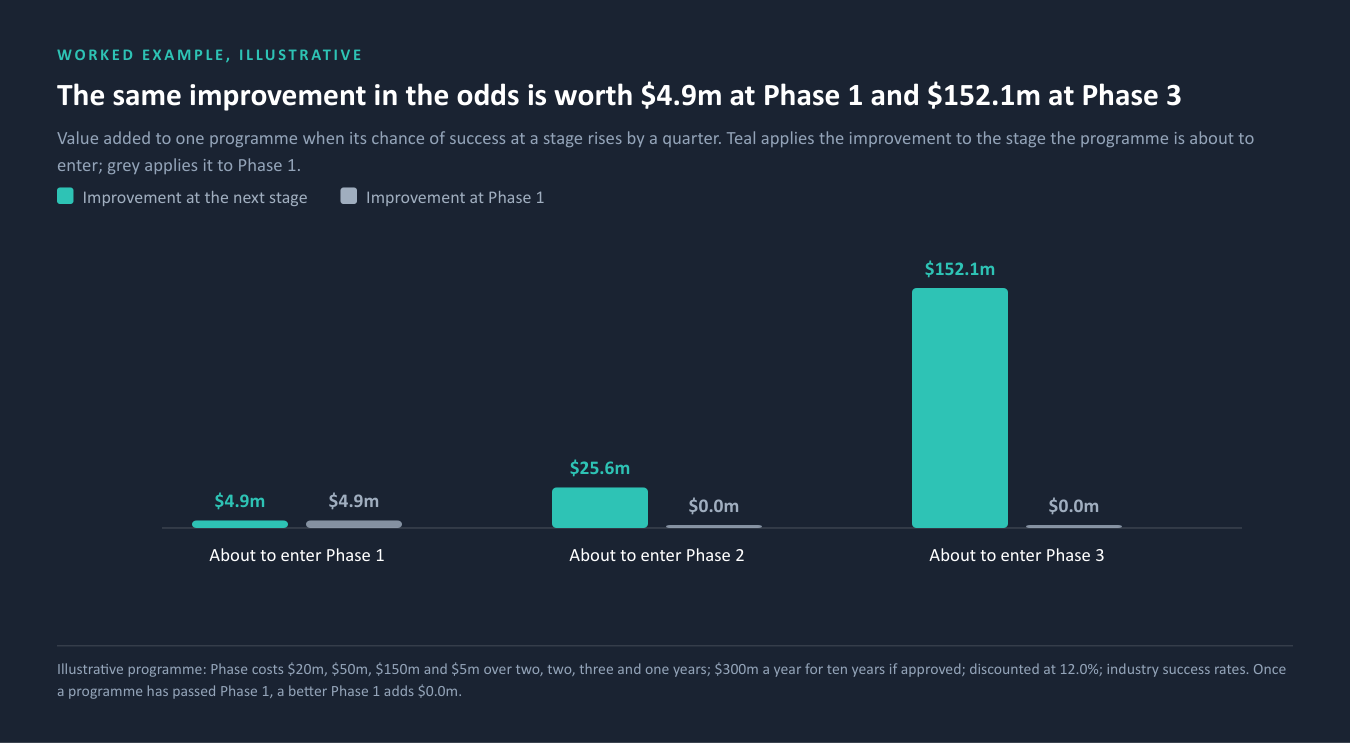
The same improvement is worth least at the stage where the evidence sits. Phase 1 is the cheapest stage and the furthest from revenue, so the value it unlocks is discounted through two more hurdles and several more years. And for a programme that has already cleared Phase 1, a better Phase 1 adds nothing: in Company A, a quarter better chance at Phase 1 adds $4.9m through the early programme and $0.0m through the programme already heading into Phase 2. The same improvement at Phase 2 would add $35.2m across both.
The ranking does not depend on the size of the improvement we assumed. At a tenth, the three values are $2.0m, $10.2m and $60.9m. At a half, they are $9.8m, $51.2m and $304.3m.
This is an argument about when and for what to pay, not against paying.
Pay for the platform where the evidence and the remaining risk sit at the same stage: a company with many programmes still ahead of Phase 1, where the proven edge applies across the whole portfolio.
Pay for the platform as an engine: a platform demonstrably generating new programmes earns its value through the number of programmes it starts, each carrying a modest early improvement.
Price the platform separately in a later round. A company whose lead programme has already cleared Phase 1 is asking you to pay for future molecules. That can be worth doing. It should be sized as a bet on what the platform produces next, not folded into the price of the lead programme.
Then test the claim itself, and credit the platform in proportion to the evidence it clears. JUDGEMENT
| Evidence | What real looks like | What a label looks like |
|---|---|---|
| Data | Proprietary or exclusively licensed data, generated at scale | Public or licensed data any competitor can buy |
| Validation | Prospective results in the laboratory or clinic, against a stated benchmark | Back-tested accuracy only |
| Protection | Protection on the model and the process, not only on the molecule | The molecule is protected and the model is replicable |
| Speed and cost | Measured time or cost to a candidate, against a comparison set | Asserted with no comparison |
| Team | Named computational leadership with retention tied to the platform | AI presented as a layer over a conventional laboratory |
Step 4: test the price. JUDGEMENT Suppose Company A is raising at a post-money valuation of $250m, with its $150m of net cash counted after the round. The round asks the family to pay $100m for everything other than cash. Three tests, each answering a different question.
| Test | What it shows for Company A |
|---|---|
| Risk-adjusted value, steps 1 and 3 | $116.9m with no platform credit, and $121.8m with full credit for a quarter better chance at Phase 1. The round sits $128.2m above the higher figure |
| The listed anchor, step 2 | The 30 listed biotechs with $100m to $200m of net cash, where both vendors agree, have a median market value of $286.4m and a median implied pipeline value of $147.9m. 3 of the 30 trade at or below cash |
| Runway | About $60m a year of spending gives 10 quarters of cash against a Phase 2 readout in 8 |
The tests disagree, and the disagreement is the finding. On risk-adjusted value, the round is expensive: $128.2m of the price rests on something the model does not value. On the listed anchor, it is ordinary: a public investor pays more for the pipelines of companies holding similar cash. The gap between the two is what the market pays for the option on future programmes and for the rights a round carries. A committee that pays this price should be able to say which of those it is paying for. And with two quarters of spare cash around the readout, a reserve for the next round is part of the price.
WHAT THIS MEANS FOR A FAMILY OFFICE
Match where the evidence sits to where the remaining risk sits. Where they match, pay for the platform. Where they do not, pay for the pipeline, and price the platform as an option on what it produces next.
What a family office carries without a fund manager
A direct cheque saves the fund manager's fee and gives up the jobs the fee paid for. Five of them come with the cheque.
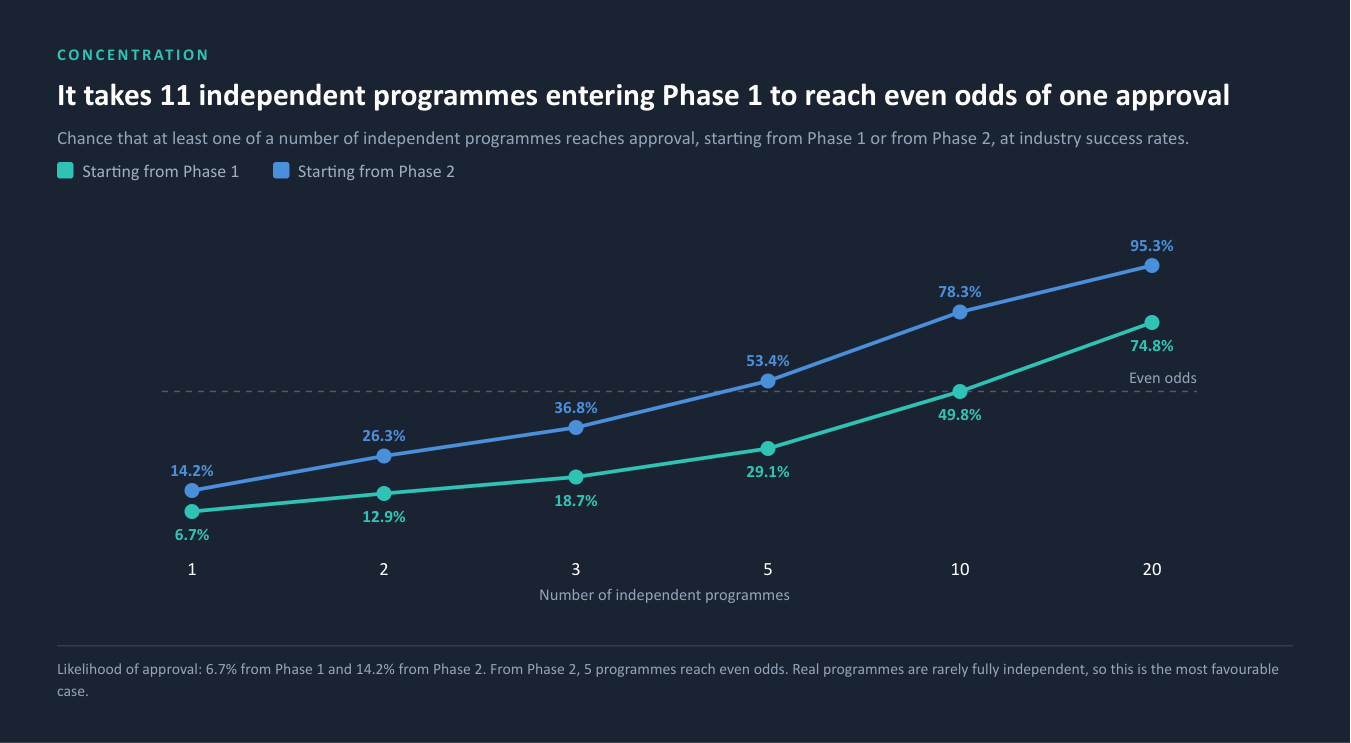
1. Concentration. At a 6.7% likelihood of approval from Phase 1, the chance that at least one of ten independent programmes reaches approval is 49.8%. It takes 11 independent programmes to reach even odds from Phase 1, and 5 from Phase 2. OURS A company with one or two lead programmes is a bet at the steep end of that curve, and real programmes are rarely fully independent.
2. The next round. Half the listed biotechs burning cash have less than 6.9 quarters of it. In private markets, biopharma companies that raised more than once came back after a median of 11.4 months, and a quarter of the gaps were 4.7 months or shorter. OURS A cheque without a reserve for the next round is a cheque that accepts dilution.
3. Knowing what the stake is worth next year. A fund marks its holdings every quarter. A family office holding a direct stake has to do it itself. Re-mark against where comparable listed pipelines trade rather than against the last round price, and write information rights into the deal that make that possible.
4. Who else is in. Ask whether specialist healthcare investors hold comparable listed companies, and whether any of them sit in this round. A private price that a specialist would not pay for the listed equivalent deserves a second look.
5. The hurdle. Three houses' published 2026 long-term assumptions for venture capital returns run from 8.5% to 12.0% a year, in US dollars over ten years or more, each cited in section 09. EXTERNAL Decide where in that range the family's hurdle sits before the pitch, not after it. Then put the same question to the alternative: a diversified life-sciences fund buys comparable exposure with more programmes on the curve above.
WHAT THIS MEANS FOR A FAMILY OFFICE
Price the fund manager's jobs into the cheque: reserve for the next round, re-mark the stake against the listed market, check who else would own it, and clear a hurdle chosen before the pitch.
What we did not write
The reported deal count. The count behind this month's press coverage belongs to a third party. We have not re-derived it, and our argument does not rely on it.
Prices for venture holdings traded between investors. The series we hold are read from published charts, and readings of the same series moved within a single day.
A return comparison for the fund route. The performance record we hold for dedicated life-sciences venture funds with a recent valuation is small, weighted to older vintages, and mostly reported by a single investor per fund. It cannot describe the category, so we point to the fund route as a question rather than a number.
Any name. We did not name a company, fund, family office, manager or individual, and we did not compare two listed companies. A comparison of two is a recommendation, not a method.
A survey figure for how many biotechs use AI. Published surveys ask different questions of different samples in different years. Section 04 gives our own measured count on a narrower, stated question instead.
A like-for-like AI improvement at Phase 2. The primary study's comparator and the industry transition rates do not share a basis, so we kept them apart.
Our AI tag as history. It reads today's business descriptions, and says nothing about which companies described themselves this way five years ago.
The family-office share of private rounds. Offering notices show the size of the pool, not who wrote the cheques.
What the investment committee asks before it signs
The six steps reduce to six questions, and an adviser who brings the answers to the meeting has done the job a fund manager would otherwise do.
1. What is the pipeline worth with the AI story removed, and where does that sit against the listed market?
2. Which stages lie ahead of the lead programme, and where is the platform's evidence? The same stage, or a different one?
3. Which rows of the evidence table does the platform clear, and what premium does that earn?
4. How many quarters of cash does the round buy against the next value event, and what is reserved for the round after?
5. How will the family mark this stake next year, and do its information rights allow it?
6. What is the hurdle, and would a fund provide the same exposure with less concentration?
Then the decision, one of four: pay the price, pay less, pay for the pipeline only, or take the exposure through a fund.
What we measured, and what we did not
The listed universe. US-listed, actively trading common stock and depositary receipts whose industry classification is biotechnology, within industry codes 2834, 2835, 2836 and 8731: 570 companies. Of 693 active companies in those codes, 123 carry other industry labels, such as large pharmaceutical manufacturers, and are excluded. The census is a cross-section of today's listed companies and makes no historical claim.
Valuation and runway. Market value on 11 September 2026; cash, short-term investments and debt from the latest reported quarter, converted to US dollars where reported otherwise; operating cash flow over the latest four quarters. 556 companies carry every field. Both vendors are checked for agreement on market value within 5%, net cash within a tenth of market value and the same balance-sheet quarter, giving 243 companies; runway additionally requires agreement within a quarter, giving 95. The agreed set tilts towards larger companies, with a median market value of $606.6m against $276.6m for all 556, which is why both bases are shown. Medians are exact interpolated percentiles.
The AI count. A keyword search of every business description, followed by a review of all 60 candidates against the rule in section 04. The review log records a reason for every exclusion. It measures self-description and reflects today's descriptions only.
The private trail. Exempt-offering notices filed by biotechnology and pharmaceutical issuers from 2019 Q1 to 2026 Q2: 8,457 filings, of which 1,540 are amendments. Each offering is counted once, on its latest filing, and the chain of amendments reconciles exactly to the filings. Amounts are self-reported, recent offerings may still be amended upwards, and not every private round is filed. The gap between successive offerings is measured for 1,530 companies that raised more than once, 3,314 gaps in all, inside a window of seven and a half years, so the longest gaps are under-represented.
Fund flows. Ten US-domiciled biotechnology sector funds reporting in US dollars, counted once each at fund level, to June 2026. Leveraged and multi-sector products are excluded.
External evidence, cited in full. Every published source is named here so each figure can be checked; the data vendors behind our own measurements are not.
- Phase transition rates for 2014 to 2023, and the 6.7% likelihood of approval: Citeline (Norstella), Why Are Clinical Development Success Rates Falling?, 16 May 2024.
- The 7.9% likelihood of approval across 12,728 transitions from 2011 to 2020: Biotechnology Innovation Organization, Informa Pharma Intelligence and QLS Advisors, Clinical Development Success Rates and Contributing Factors 2011 to 2020, February 2021.
- AI-discovered molecule success rates: Jayatunga M.K.P., Ayers M., Bruens L., Jayanth D. and Meier C., How successful are AI-discovered drugs in clinical trials? A first analysis and emerging lessons, Drug Discovery Today, volume 29, issue 6, 2024. It reports on a limited sample drawn from disclosed pipelines, and we quote it against its own comparator only.
The hurdle. Venture capital return assumptions for 2026, in US dollars, shown as a range and never averaged:
- Cliffwater, 2026 Asset Allocation Report, 16 January 2026: 12.0%.
- J.P. Morgan Asset Management, 2026 Long-Term Capital Market Assumptions, executive summary, Exhibit 5, net of fees: 8.5%.
- Northern Trust Asset Management, Capital Market Assumptions, 10-Year Outlook, 2026 Edition, December 2025: 10.5%, benchmarked to a Cambridge Associates venture capital index.
We checked each figure against the published document before naming it. Our internal store had carried one house's previous-year figure under the 2026 label, and the range uses the published 2026 value.
The worked example. Every input is an assumption chosen for illustration and stated in full. The improvement in success rates is an assumed quarter, shown at a tenth and a half as well. It describes no real company.
Where this could be wrong. Vendor data on small companies disagrees more than we would like, which is why both bases are shown. Business descriptions are written by others and change. Industry success rates vary widely by disease area and type of medicine, so a committee should replace the averages with rates for the programme in front of it. All figures are as at the dates stated and will move.
If this is useful
Let us keep the listed anchor current for your committee, refreshed each quarter on the same definition, so every price test and every annual mark on a direct stake has a market reference behind it.
Or send us one proposed round, with the stage of its lead programme, the round size and the post-money valuation, and we will return a single page: where its implied pipeline value sits against the listed market, its runway against the next value event and the typical gap between rounds, and the hurdle it has to clear.
Or take the six steps and run them on the deal on your desk. They need nothing from us.
Important information
This note is for professional investors only and is not investment advice or a recommendation to buy or sell any security. The worked example is illustrative and describes no real company. Figures are as at the dates stated.