Product design
Nine Funds Is Not a Category
An allocator asked for something ordinary: a balanced portfolio built from liquid alternative exchange-traded funds. The shelf could not supply it. We counted what is actually on that shelf, and then tested whether the case for filling it survives its own assumptions.
Three Horizons Capital · 7 September 2026 · Census of US-listed exchange-traded funds as at 5 September 2026. Return figures are weekly over 342 weeks to 10 July 2026, in US dollars. Fees are compared only within the exchange-traded wrapper. For professional investors. No fund, provider, ticker, manager or individual is named anywhere in this note.
39
funds in the entire US alternative exchange-traded fund shelf, holding $23.6bn
9
long/short equity exchange-traded funds in existence, the flagship strategy of the category
0 of 4
comparisons the alternative construction wins once you stop assuming its past outperformance repeats
The finding in one line
The demand is real and the shelf is nearly empty. Three of the four reasons it is empty are problems a product team can solve. The fourth is the product itself.
An ordinary request the shelf cannot fill
Start with the request, because it is the most ordinary thing in this note.
An allocator asks for a balanced portfolio, sixty per cent growth and forty per cent defensive, built entirely from liquid alternative exchange-traded funds. They ask that two strategies be represented: long/short equity on the growth side, and long/short fixed income on the defensive side. Nothing exotic. Two of the oldest ideas in alternatives, in the wrapper everybody now buys.
Three things happen when you try to fill it.
The fixed income strategy they named does not exist as a category. There is no classification for long/short fixed income. To answer the question at all you have to substitute something adjacent, in this case funds that run unconstrained or rate-hedged bond exposure, and then say out loud that you have substituted.
The screen returns single digits. Nine funds cleared it across both sleeves.
A tenth was excluded for having too little price history to sit in a risk estimate at all.
That is not a difficult screen producing a thin result. That is a thin shelf.
WHAT THIS MEANS FOR A PRODUCT TEAM
The first barrier to this category is not performance, distribution or fee. It is that one of the two strategies the client named has no home in the classification everybody screens, ranks and shelves by. A product that cannot be screened for cannot be found, and a category with no label cannot be compared. Before anything else, that is the gap.
The shelf, counted
We counted the whole thing rather than taking the screen's word for it.
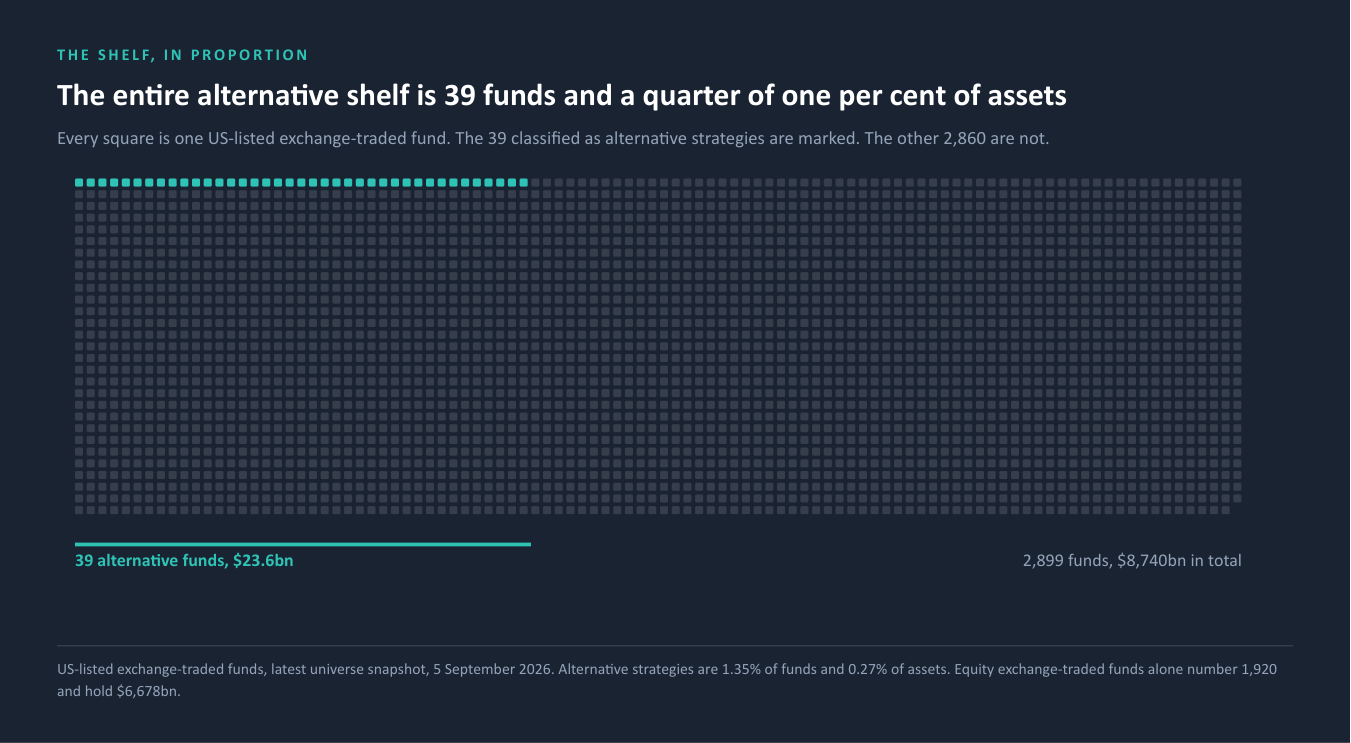
Across the entire US-listed exchange-traded fund market of 2,899 funds holding $8,740bn, the funds classified as alternative strategies number 39, holding $23.6bn. That is 1.35% of funds and 0.27% of assets. For scale, equity exchange-traded funds alone number 1,920 and hold $6,678bn.
Broken into the strategies a buyer would actually name:
| Strategy | Funds | Assets | Median age | Oldest |
|---|---|---|---|---|
| Multi-asset overlay | 12 | $4.1bn | 2.9 yrs | 8.1 yrs |
| Systematic trend | 11 | $7.8bn | 3.2 yrs | 15.7 yrs |
| Unconstrained and rate-hedged bond | 10 | $7.0bn | 8.3 yrs | 15.8 yrs |
| Long/short equity | 9 | $6.5bn | 0.9 yrs | 16.7 yrs |
| Multi-strategy | 6 | $8.4bn | 3.4 yrs | 17.5 yrs |
| Equity market neutral | 3 | $0.7bn | 1.0 yrs | 15.0 yrs |
| Event driven | 3 | $0.8bn | 9.5 yrs | 16.8 yrs |
| Macro trading | 2 | $0.2bn | 0.7 yrs | 1.4 yrs |
| Relative value arbitrage | 2 | $1.6bn | 0.2 yrs | 0.4 yrs |
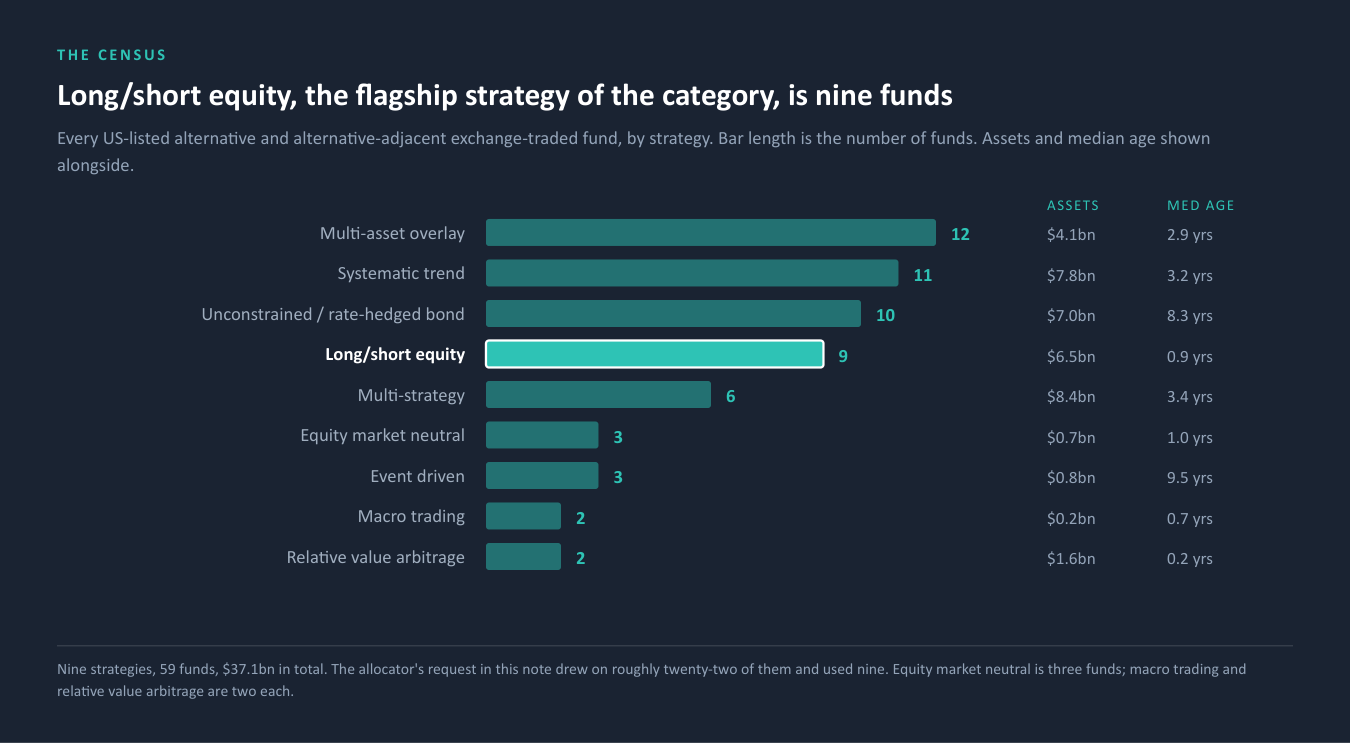
Long/short equity, the strategy at the centre of every liquid alternatives conversation for twenty years, is nine funds. Equity market neutral is three. Macro trading is two. Relative value arbitrage is two, and both launched within the last five months.
The allocator's request drew from a pool of roughly twenty-two relevant products and used nine of them. That is not a portfolio built from a market. It is a portfolio built from an inventory.
Two more facts a product team should hold.
The shelf is concentrated. The five largest funds hold 48% of the assets across the wider shelf, and the ten largest hold 67%. The median fund holds $275m; ten of the fifty-nine hold under $50m.
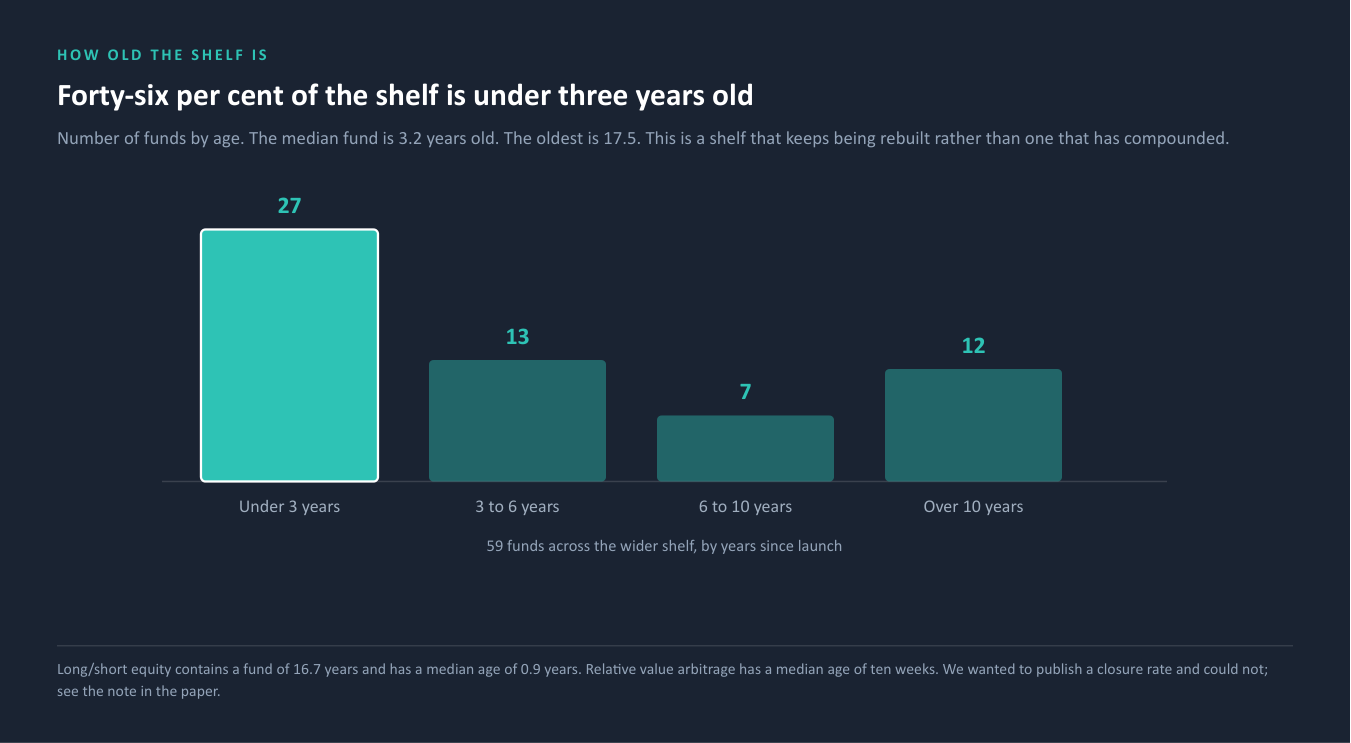
The shelf is young, and keeps being rebuilt. Median age is 3.2 years, and 46% of it is under three years old. Long/short equity contains a fund of 16.7 years and has a median age of 0.9 years, which is a category that has been almost entirely replaced rather than one that has grown.
A CAUTION WE WOULD RATHER STATE THAN BURY
We wanted to publish a closure rate, because how many of these funds fail is the single most useful number a product team could have. We cannot. Our fund universe is a daily snapshot beginning in late February this year, and its earliest snapshots swing between roughly 12,600 and 22,000 funds as the feed came up to full coverage. The gap between identifiers ever seen and identifiers seen today is a coverage artefact, and reporting it as a closure rate would be a serious error. We are telling you what we wanted to measure and could not, rather than presenting the age distribution as though it were the same thing.
What the nine actually deliver
Now the performance question, on the nine funds the allocator's screen produced, over the 342 weeks in which all of them existed together.
| Portfolio | Return | Volatility | Risk-adjusted | Worst fall |
|---|---|---|---|---|
| Alternative 60/40 | 6.28% | 6.34% | 0.50 | -14.4% |
| Traditional 60/40 | 9.75% | 12.59% | 0.53 | -21.6% |
| Alternative 70/30 | 6.60% | 6.72% | 0.52 | -14.5% |
| Traditional 70/30 | 11.21% | 14.21% | 0.57 | -24.3% |
| Alternative equity only | 7.53% | 8.08% | 0.55 | -14.7% |
| Traditional equity only | 15.48% | 19.26% | 0.64 | -32.2% |
| Alternative fixed income only | 4.31% | 5.39% | 0.22 | -13.9% |
| Traditional fixed income only | 0.66% | 5.98% | -0.41 | -18.1% |
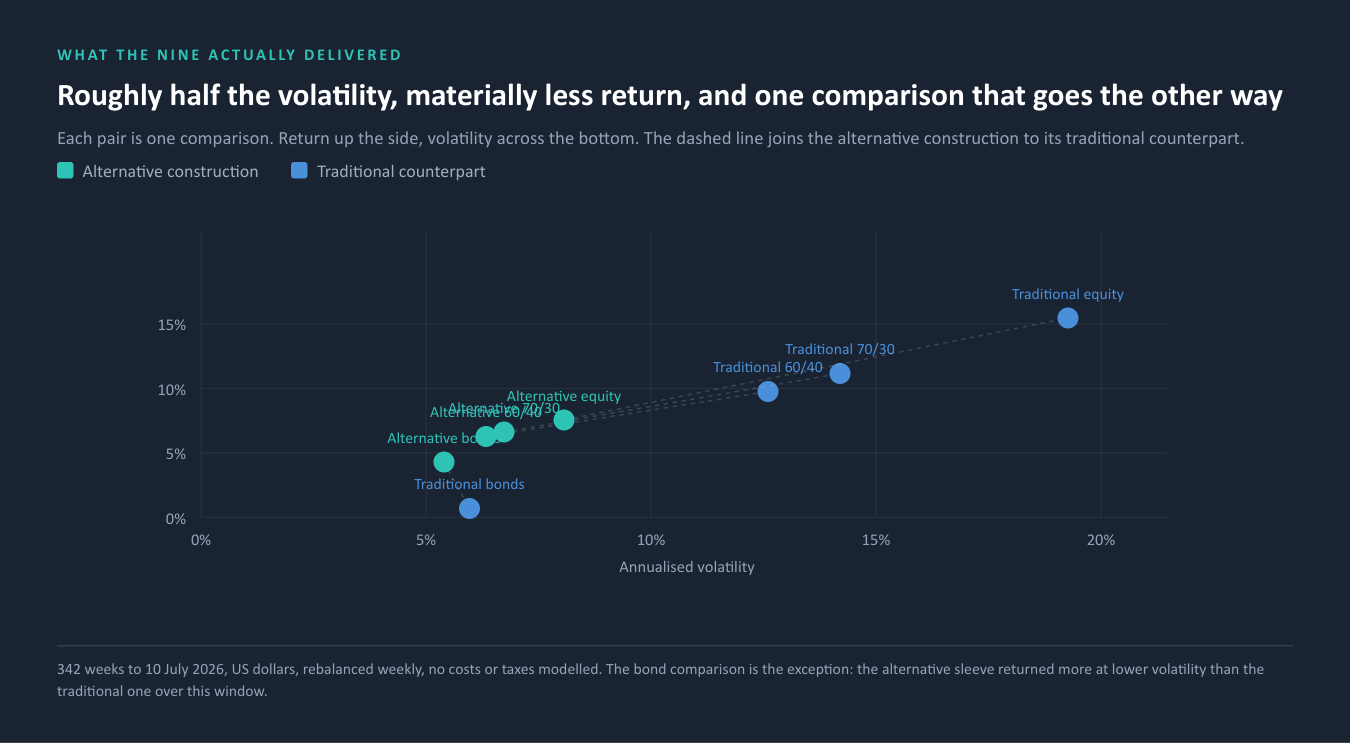
The equity-anchored comparisons are a straight trade. Around half the volatility, around two thirds of the drawdown, materially less return, and a risk-adjusted outcome fractionally below the traditional book in every case. That is a capital-preservation product, not a return product, and it should be sold as one.
The fixed income comparison is the interesting one. The traditional bond sleeve delivered 0.66% a year over this window with 5.98% volatility, which is a negative risk-adjusted return. The alternative sleeve delivered 4.31% at 5.39%. On this window, in this regime, the alternative fixed income sleeve is not a defensive substitute. It is simply better.
And one year carries the whole case. In the single year when equities and bonds fell together, the alternative construction lost low single digits against a traditional loss in the mid teens. In the acute shock at the start of the window the two fell almost identically. The diversification did not show up when markets broke quickly. It showed up when they broke slowly.
The forward numbers say something much better
Everything above is backward-looking, and the window flatters one side. Traditional equity returned 15.48% a year over it, roughly double any sensible forward assumption. So the fair test is to price both books on the same forward view rather than on what happened to occur.
Doing that reverses the answer.
Each fund's sensitivity to equities and to bonds is measured over the window, those sensitivities are priced at forward premia, and each fund's measured outperformance is carried forward. Volatility is held at its realised level for every portfolio, so one convention applies to both sides of every comparison.
| Comparison | Alternative | Traditional |
|---|---|---|
| 60/40 | 0.53 | 0.29 |
| 70/30 | 0.53 | 0.28 |
| Equity | 0.50 | 0.25 |
| Fixed income | 0.45 | 0.30 |
On forward assumptions the alternative construction wins all four comparisons, and not narrowly. This is the strongest argument the category has, and it is a genuine one: the traditional book's advantage in the realised record was a function of an equity market that returned roughly double what anyone expects next.
If that held, it would be a launch case on its own.
Now take the outperformance away
It does not hold, and the reason is arithmetic rather than opinion.
Each fund's forward return has three parts: cash, its measured market sensitivity priced at forward premia, and the outperformance it delivered over the past six years, carried forward unchanged. No decay, no fade, no adjustment.
So set that last part to zero. Change nothing else. Same funds, same sensitivities, same volatilities, same forward premia.
| Comparison | Alternative, as computed | Alternative, outperformance removed | Traditional |
|---|---|---|---|
| 60/40 | 0.53 | 0.22 | 0.29 |
| 70/30 | 0.53 | 0.21 | 0.28 |
| Equity | 0.50 | 0.18 | 0.25 |
| Fixed income | 0.45 | 0.25 | 0.30 |
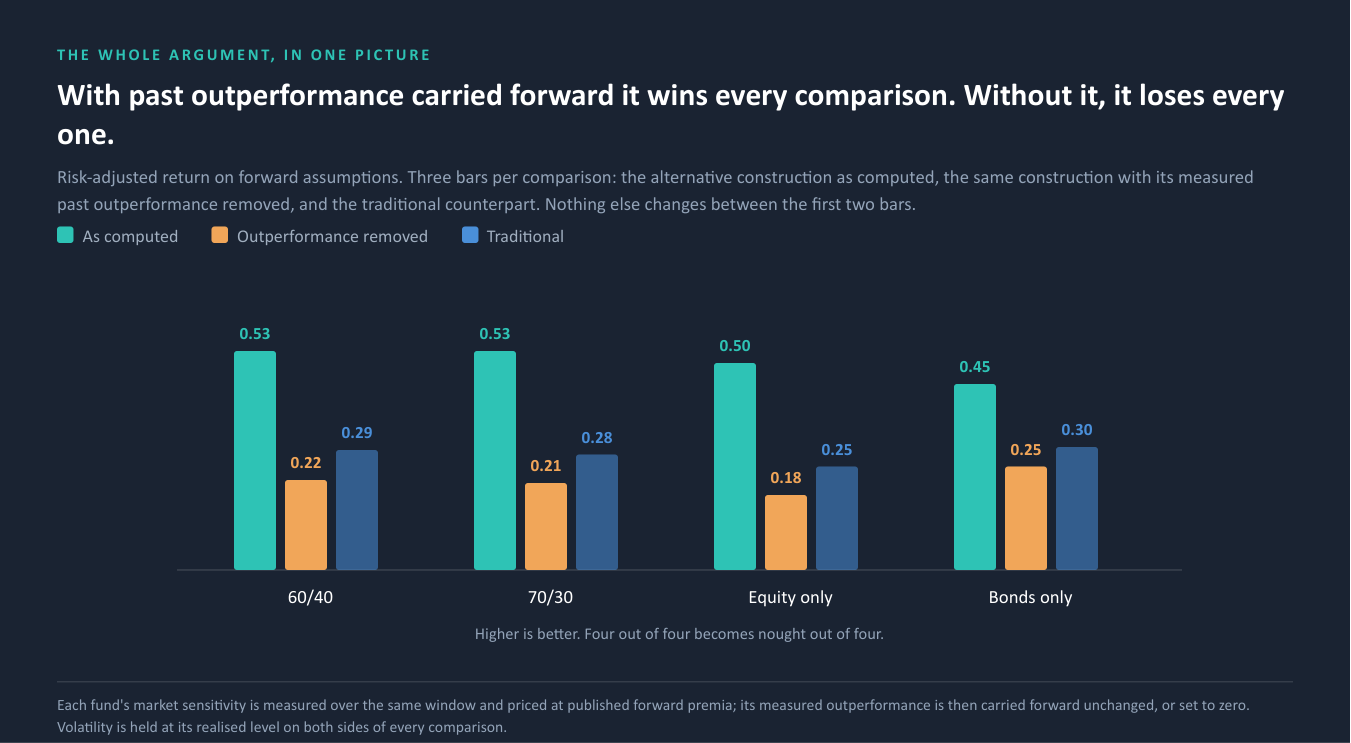
Four out of four becomes nought out of four. The advantage does not narrow. It inverts, in every single comparison, and the fixed income sleeve, the strongest result in the whole exercise, inverts with the rest.
There is a structural reason this was always going to happen. The risk-adjusted return of any portfolio assembled purely from market exposures is set by the premia themselves, not by how much of them you hold. Holding less does not improve it. So a low-exposure portfolio can only beat a high-exposure one on a forward view by carrying something that is not market exposure. In this framework that something is six years of residual, worth roughly two percentage points a year in the balanced books and 2.6 points in the equity sleeve.
THE PRACTICAL CONSEQUENCE
The forward case for this category is not a diversification case. It is an outperformance case wearing a diversification jacket, and it is priced at many times the passive alternative.
That is a product you can absolutely launch. But it changes what you have to prove. A diversification product is sold on structure, which is observable in advance. An outperformance product is sold on evidence of skill, to a buyer who has been shown a backtest before and has learned what they are worth. Those are different sales, different due diligence questions, and different odds.
Why the shelf is empty
Four barriers. Each of them is measurable, and only one of them is the product.
| Barrier | What it is | Can a product team solve it? |
|---|---|---|
| Classification | One of the two strategies the client named has no category. Nineteen of the fifty-nine funds a buyer would call alternative are not classified as alternative at all | Partly, and slowly |
| Scale | Median fund $275m, ten under $50m, and the five largest hold 48% of the shelf | Yes, with distribution |
| Risk coverage | Standard institutional factor models carry no loadings for derivative-driven long/short and market-neutral strategies. On this basket the coverage came back at nothing | Yes, and it is a moat for whoever does it |
| The evidence problem | Section 05 | No |
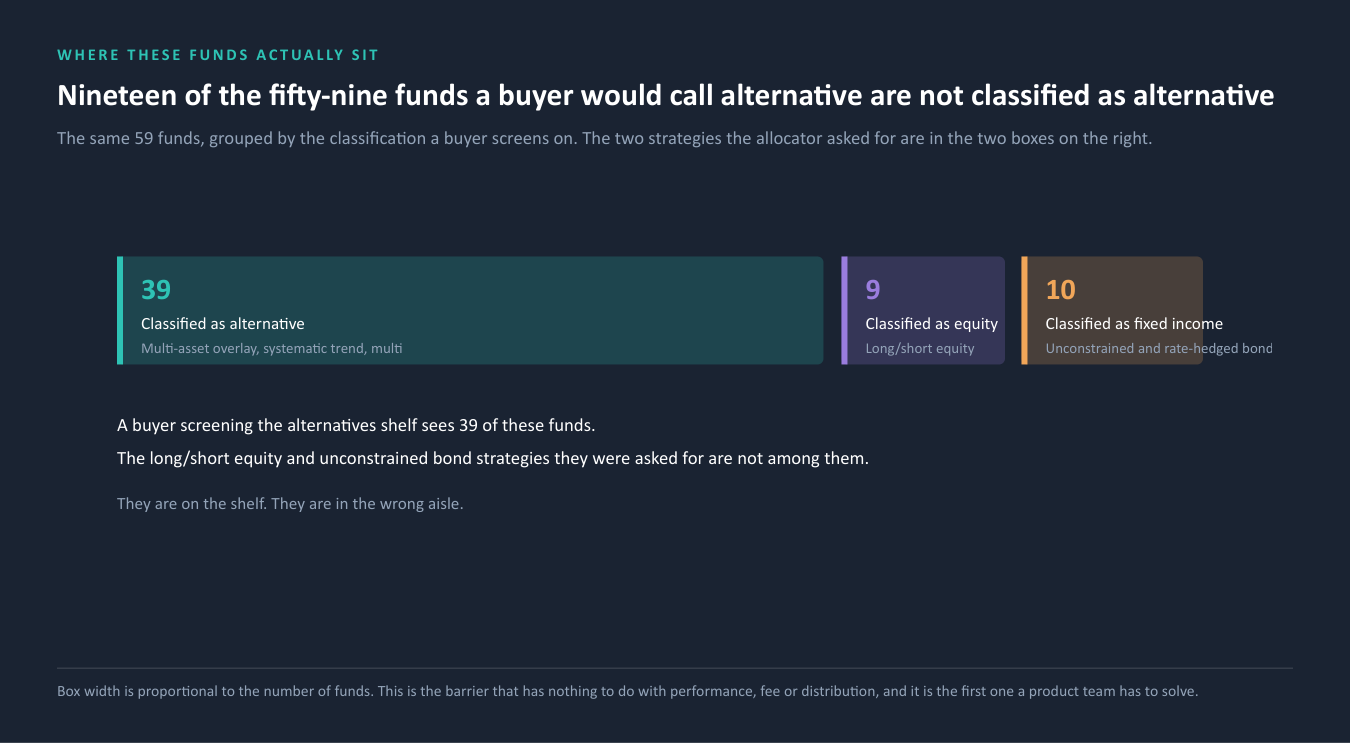
The classification barrier is worse than a labelling annoyance. Long/short equity is filed under equity. Unconstrained and rate-hedged bond funds are filed under fixed income. Only the remaining thirty-nine sit under alternatives. So a buyer screening the alternatives shelf does not see the two strategies the allocator actually asked for. They are on the shelf. They are in the wrong aisle.
The risk-coverage barrier is the most interesting commercially. An allocator running an institutional process cannot put a product through their existing risk framework if the framework has no loadings for it. That forces them to make an exception, and exceptions are a much longer sale. Whoever solves that for this category, by publishing usable risk characteristics rather than asking for a leap of faith, removes the barrier that keeps these products in the satellite bucket.
Three of these four are execution problems. The fourth is the thing you are selling.
What we did not write
Five claims were available in this work. Each would have made it tidier. None is here.
1. We could have published a closure rate. It is the number a product team most wants and we do not have the history to compute it. Our universe snapshot begins in late February and its early weeks are unstable as the feed came up. We could have differenced identifiers and called it attrition. It would have been wrong by an order of magnitude.
2. We could have quoted true total cost. The fee field we can measure excludes dividend and borrow expense on short positions, which is precisely where these strategies incur cost. On one fund in the source basket the published all-in charge is more than half a point above the fee we can measure. So we publish the fee we can stand behind, say it understates, and do not build an argument on it.
3. We could have left the forward numbers where we found them. Presenting section 04 and stopping would have produced a much more saleable paper and a much less true one.
4. We could have compared across wrappers. Comparing an exchange-traded fund's fee to a fund with a different structure and liquidity promise is the easiest way to make any of these numbers say whatever you want. Everything here stays inside one wrapper.
5. We could have named the products. Nine funds is a small enough number that naming them would have made this concrete and turned a category finding into a league table. Nothing here names a fund, a provider or a ticker, and every finding survives without them.
WHY THIS SECTION IS HERE
You cannot verify our accuracy from a document. What you can verify is whether a firm tells you what it could not measure before you ask. All five of the above were available to leave out.
What a product team does about it
Four questions, answerable against your own shelf this week.
1. Is the gap on your shelf the one the client is naming? If a widely requested strategy has no category in the classification everybody screens by, your own product taxonomy almost certainly has the same hole, and your competitors' screens will not surface you either. That is a positioning decision before it is a build decision.
2. What is your evidence of outperformance, and over what window? Section 05 is the question your buyer will ask in the second meeting. If the answer is a backtest of funds that survived, it is the same answer everyone else gives, and the buyer has seen it. The products in this census with the least assumption-dependent numbers are the ones running the least discretion, which is an uncomfortable finding for anyone selling skill.
3. Can an allocator put your product through their existing risk process? If the standard models carry no loadings for what you have built, you are asking for an exception. Publishing usable risk characteristics is cheaper than winning that argument fund by fund, and nobody in this category has done it.
4. What do you actually cannibalise? The honest comparison is not against the passive book. It is against whatever you already sell into the same sleeve, at what margin.
Then the decision, and there are four honest answers. Build it, because the gap is real and you can evidence the thing that makes it work. Do not build it, because you cannot. Build it differently, positioned on structure rather than on outperformance, which section 03's fixed income result supports better than anything else here. Or sell what you already have to a different buyer, because the classification problem means the people who want this are not looking where you are listed.
What we measured, and what we did not
The census, defined precisely, because you will want to test it against your own products. US-listed exchange-traded funds only, taken from the most recent daily snapshot of our fund universe, 5 September 2026. The strict shelf is every fund whose broad classification is alternative strategies: 39 funds, $23.6bn. The wide shelf adds the two adjacent categories that sit outside that group, long/short equity and unconstrained or rate-hedged bond: 59 funds, $37.1bn. No mutual funds, no interval funds, no funds listed outside the United States. If your product is a US-listed exchange-traded fund in one of those nine strategies, it is in this count.
Returns. Weekly, 342 weeks, 27 December 2019 to 10 July 2026, in US dollars. That window is set by the youngest fund in the basket. Five instruments come from a weekly series and six from a daily total-return series resampled to weekly, which introduces a small sampling difference typical of less liquid strategies. Rebalanced weekly to fixed weights. No transaction costs, taxes or slippage.
Forward figures. Each fund regressed on the two market series over the same window, its measured sensitivities priced at published forward premia, and its measured residual carried forward unchanged. Volatility is held at its realised level for every portfolio, on both sides of every comparison. We note that the source work we reviewed used realised volatility for the alternative books and published assumption volatility for the traditional ones; we have used one convention throughout.
Fees. The management fee field, compared only within the exchange-traded wrapper. It understates true cost on funds carrying short exposure, as section 07 says.
What we did not do. We have taken no view on where markets go next. We have not modelled cost or tax. We have not measured a closure rate. We have not counted shelves outside the United States, which is the obvious next question for anyone launching in Europe and is not answered here.
Where this could be wrong. The census is a point in time on a shelf where 46% of the funds are under three years old, so it will move. The performance work rests on nine funds that existed throughout a single six-and-a-half-year window containing one pandemic, one hiking cycle and one equity re-rating. Any measured outperformance estimated over that window carries its regime with it, which is the whole point of section 05.
If this is useful
Take the census definition and run it on your own shelf. Section 09 is the whole method. It needs nothing from us.
Or send us one product name and we will come back with a single page: where it sits in the size and age distribution of its category, how its fee compares within the wrapper, and how much of its record is market exposure rather than skill.
Or let us map the gap rather than the product. Which parts of this shelf carry demand and no supply, on the same census, and what the European shelf looks like beside it.
Important information
Important information. Published by Three Horizons Capital for general information and education. It is not investment, legal, tax or accounting advice, not a research recommendation, and not an offer or solicitation to buy or sell anything. It is not a personal recommendation and takes no account of any person's objectives, financial situation or needs. Three Horizons Capital is not a regulated entity. No fund, provider, ticker, manager, issuer or individual is named anywhere in this material. Figures derive from the Three Horizons Capital data platform and were fixed to a single derivation on 7 September 2026, from which the text and every chart read. Past performance is not a guide to future performance, and the behaviour described here may not persist.