Portfolio construction
Don't Call the Top. Build for How It Ends.
Nobody can date the end of this bull. What ends it decides the damage, and a portfolio can be built for both endings today.
Three Horizons Capital, Portfolio Analytics. Market data to 6 October 2026; unemployment to September 2026; headline CPI to August 2026. US dollars.
41%
Share of S&P 500 market value held by its ten largest companies, up from 29% at the October 2022 trough
51%
Share of a standard 60/40 portfolio's risk that comes from those ten companies, on 25% of its capital
58 to 74 months
Time the index took to recover after a credit or valuation ending, against 6 to 23 months after a policy shock
The finding in one line
The ending matters more than the date: a book built for both a valuation ending and a rate shock lost less in each of the last four endings, at a cost of about 0.3 points a year in this bull.
This bull broke the rulebook on day one
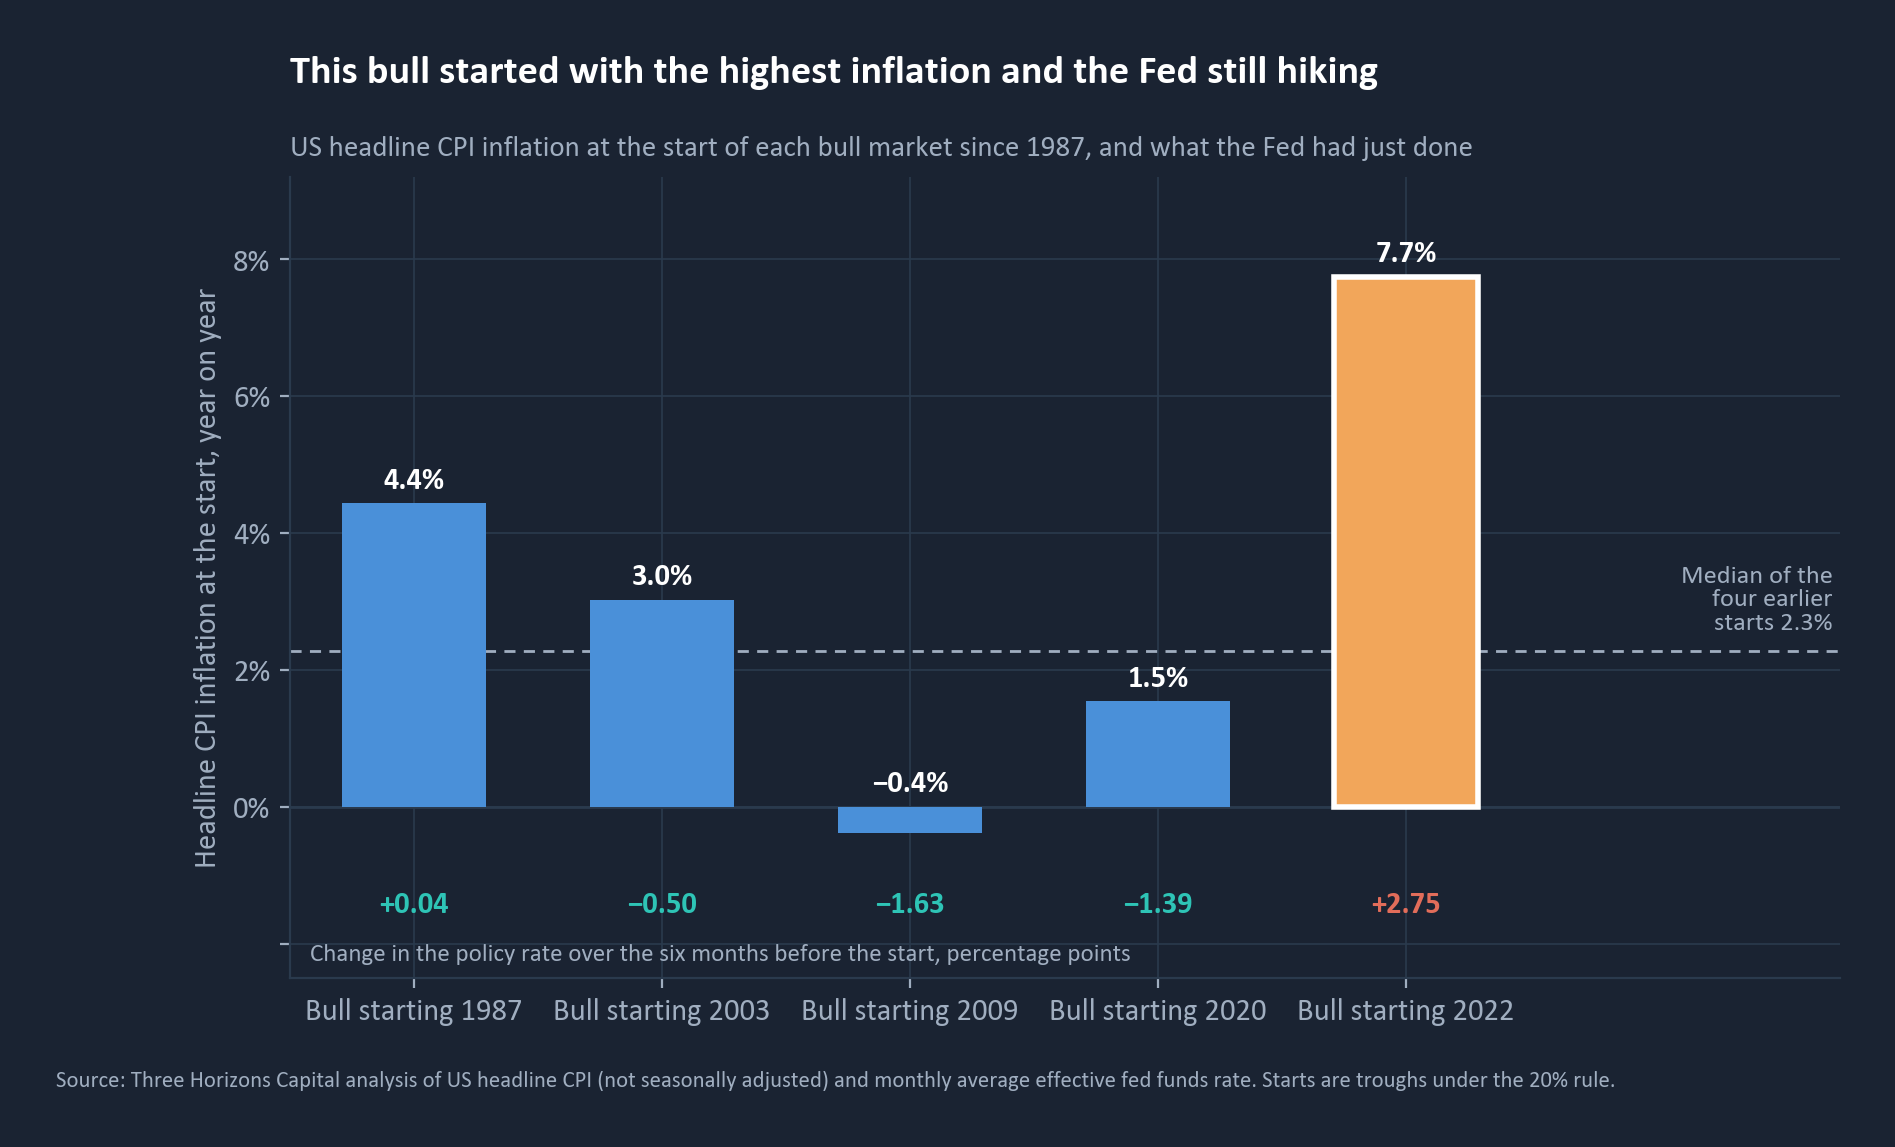
Every earlier bull since 1987 started with the policy rate flat or falling and headline CPI inflation at a median 2.3%. This one started on 12 October 2022 with inflation at 7.7% and the Fed having raised rates 2.75 points in the previous six months. Averages from earlier bulls are a weak guide to how this one ends.
The index is no longer the market
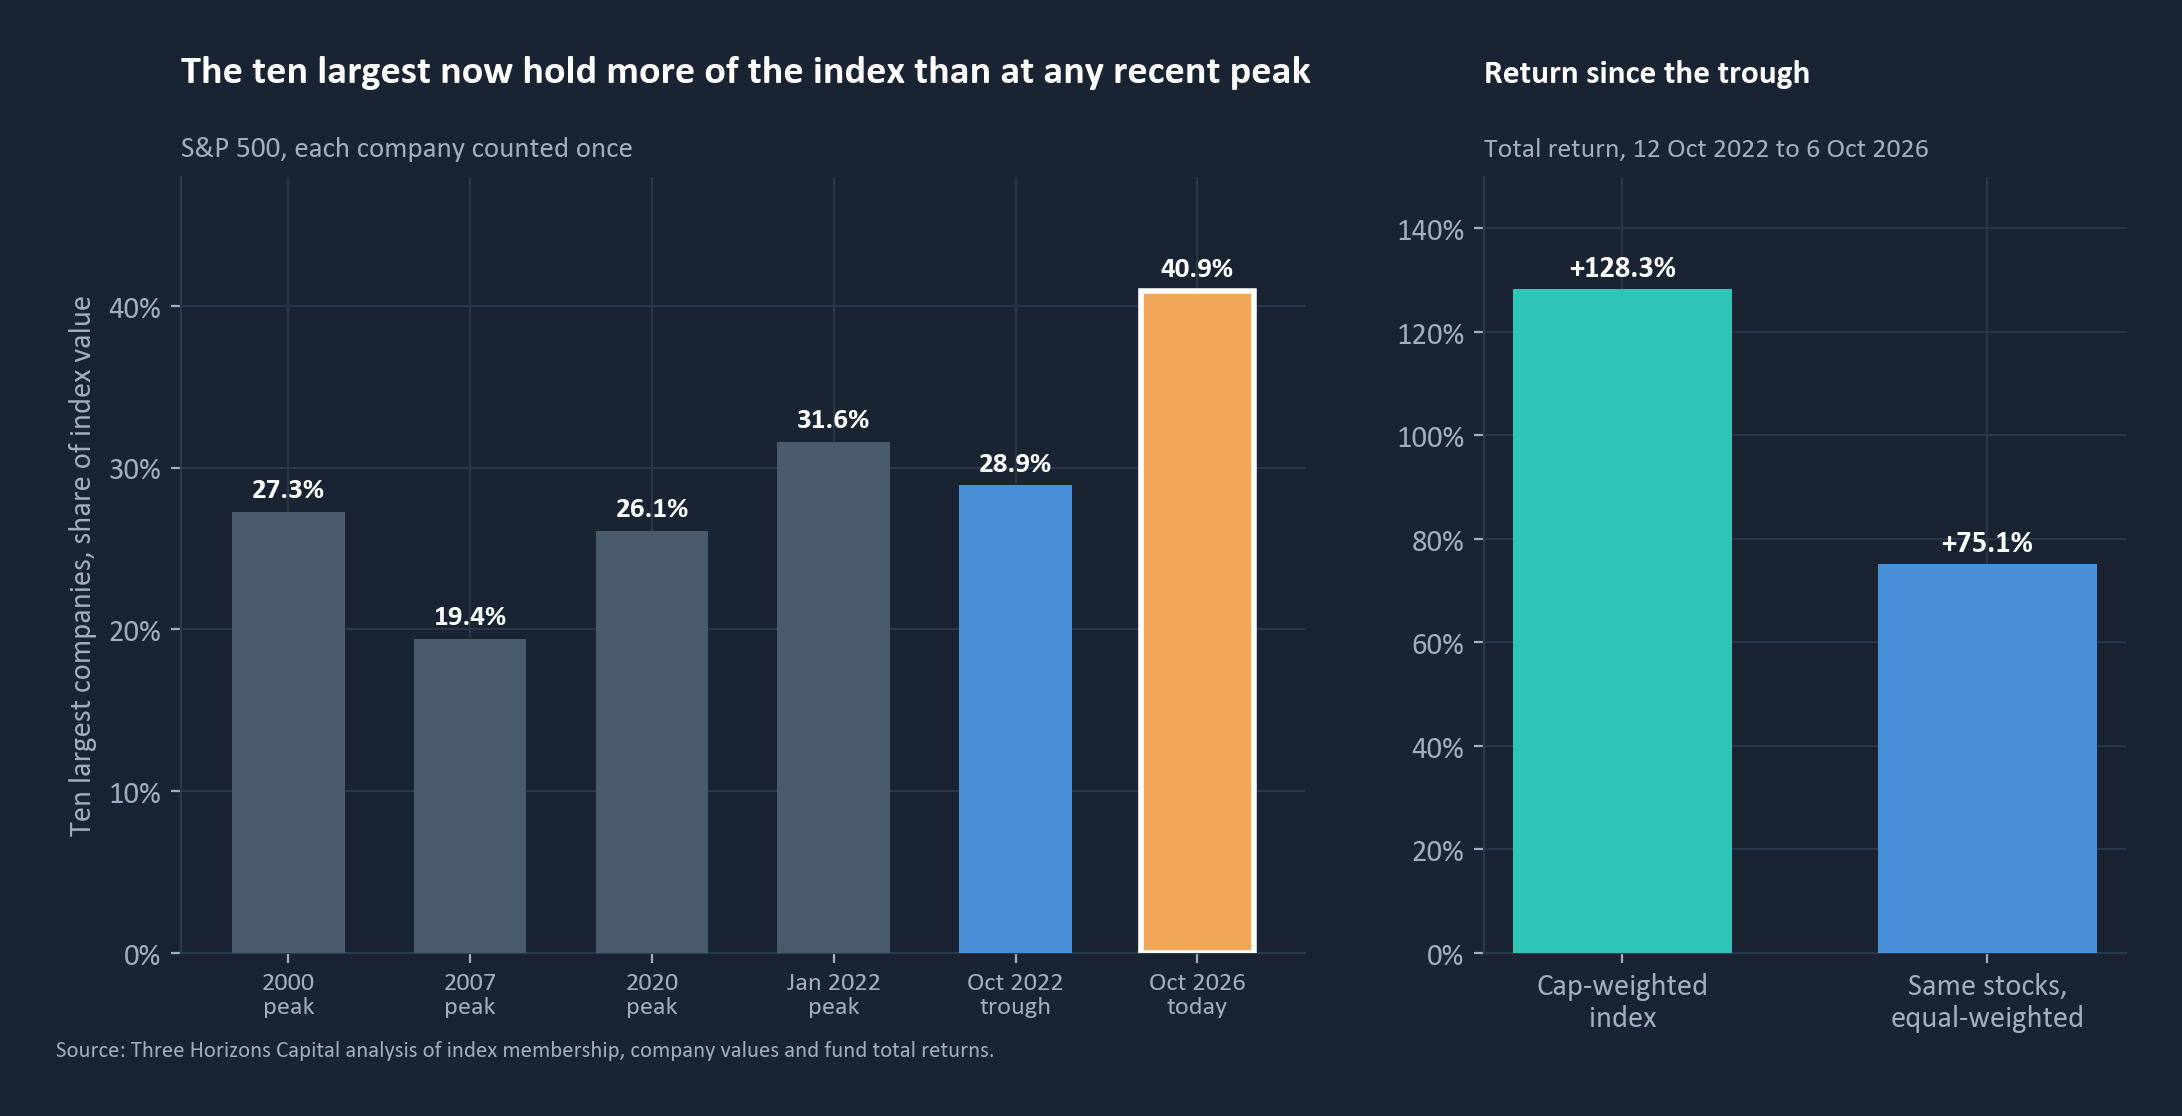
The ten largest companies in the S&P 500 now hold 40.9% of its market value, up from 28.9% at the trough and higher than at any of the last four bull-market peaks. They are dominated by AI and semiconductor mega-caps. Since the trough the cap-weighted index has returned 128.3%; the same stocks equally weighted returned 75.1%. Over the past two years those ten carried 41% of the index's weight and 54% of its risk.
The dashboard is flashing late-cycle
The 3HC financial conditions index (higher = tighter) is at 1.02, tighter than at any of the last four peaks. The 10-year Treasury yield is 5.27%, up from 4.19% in January. Unemployment, at 4.2%, sits inside the band seen at prior peaks. On 16 September the Fed raised rates by a quarter point to 3.75% to 4.00%, its first hike since 2023, citing elevated inflation. Headline CPI was 3.4% in August, driven by energy prices up 16.3% over the year; core inflation was 2.4%.
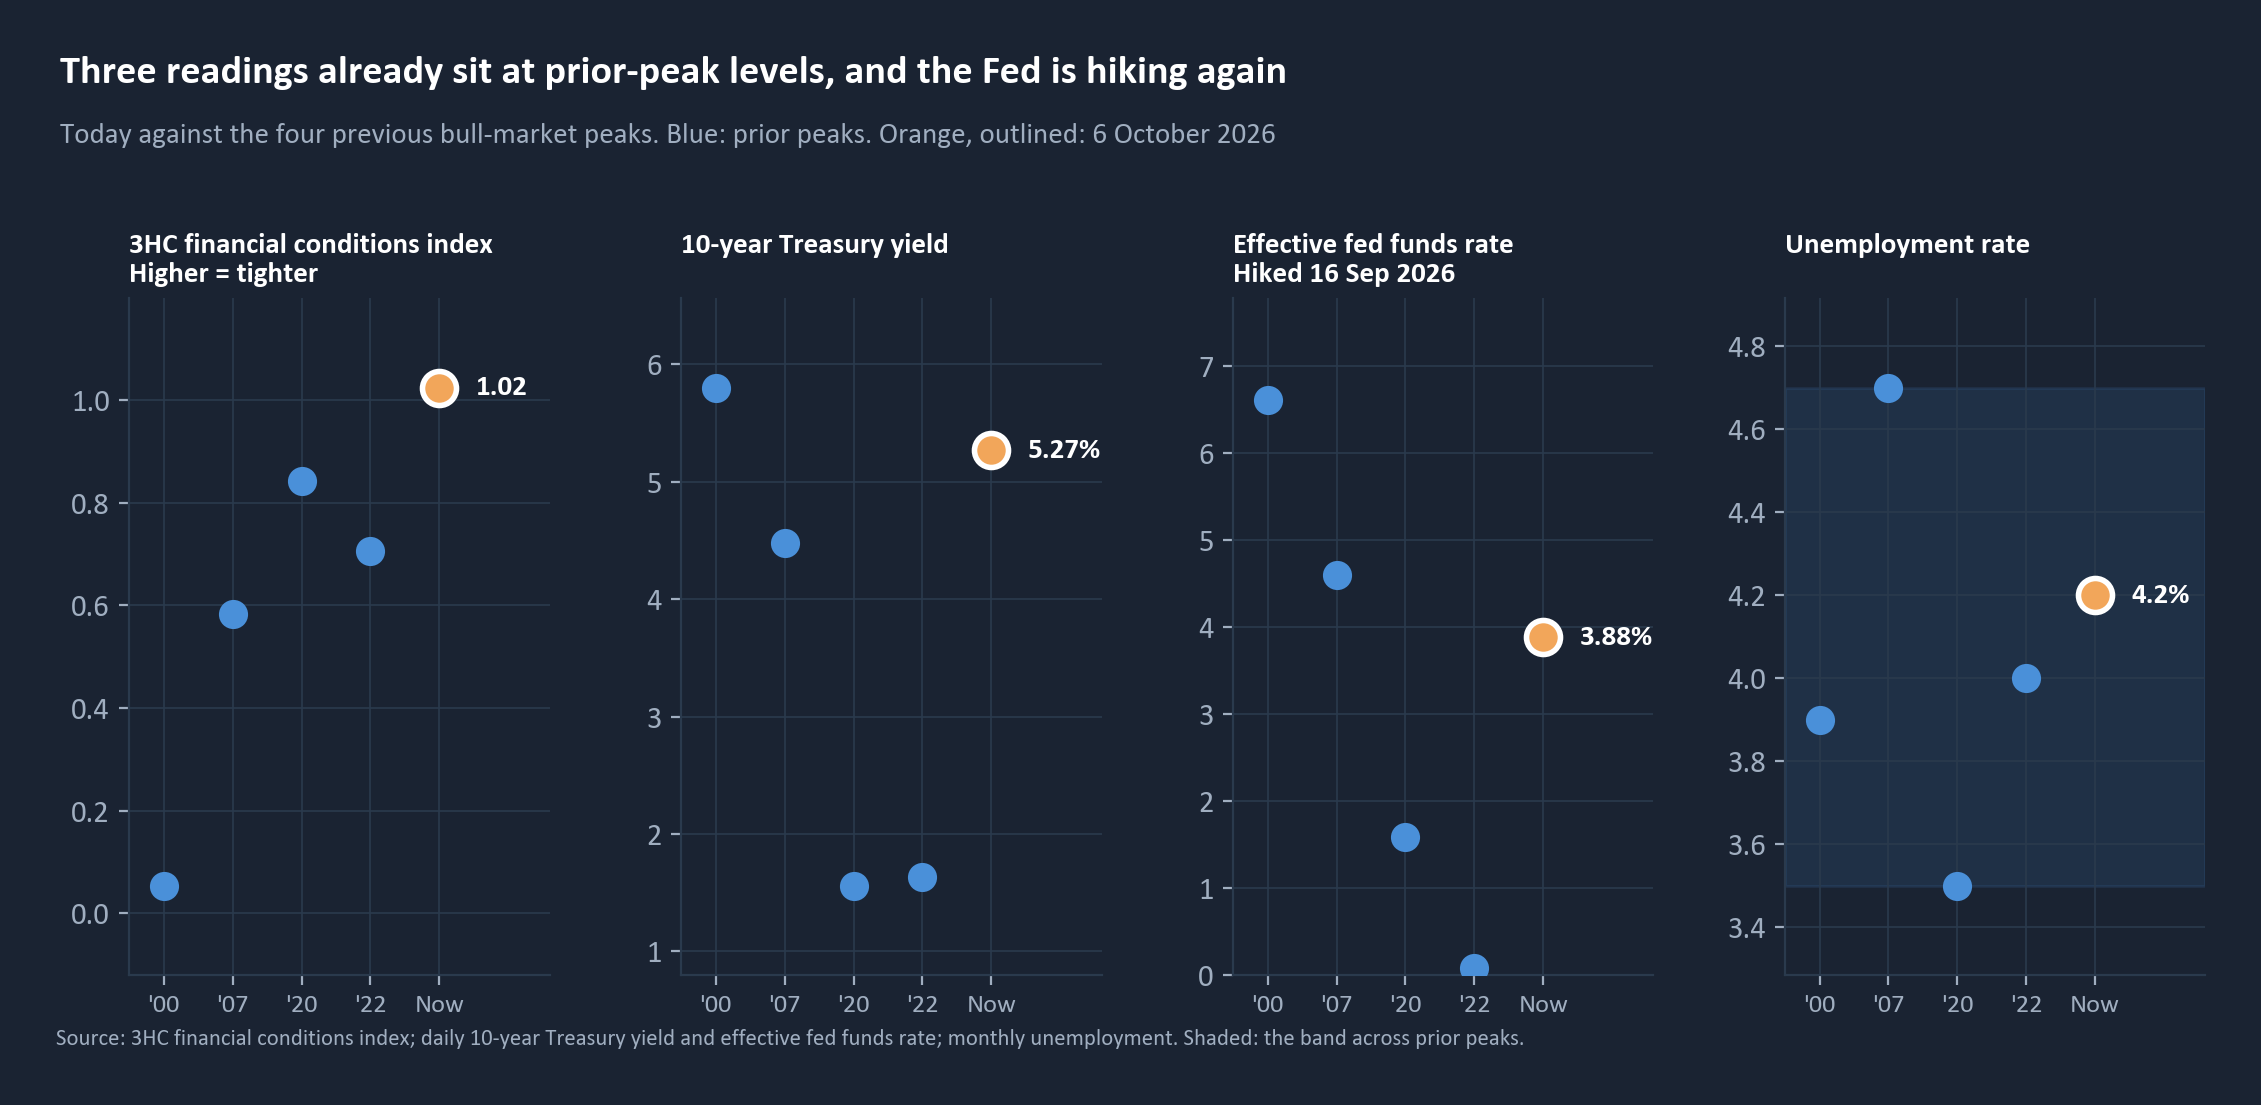
None of this dates a top. Several of the conditions that preceded the last four endings are already in place.
How it ends matters more than when
| Ending | Largest fall | Months to regain the peak |
|---|---|---|
| Dot-com, valuation (2000) | −47.4% | 73.8 |
| Financial crisis, credit (2007) | −55.3% | 58.3 |
| COVID, exogenous shock (2020) | −33.8% | 5.7 |
| 2022, rate shock | −24.6% | 23.3 |
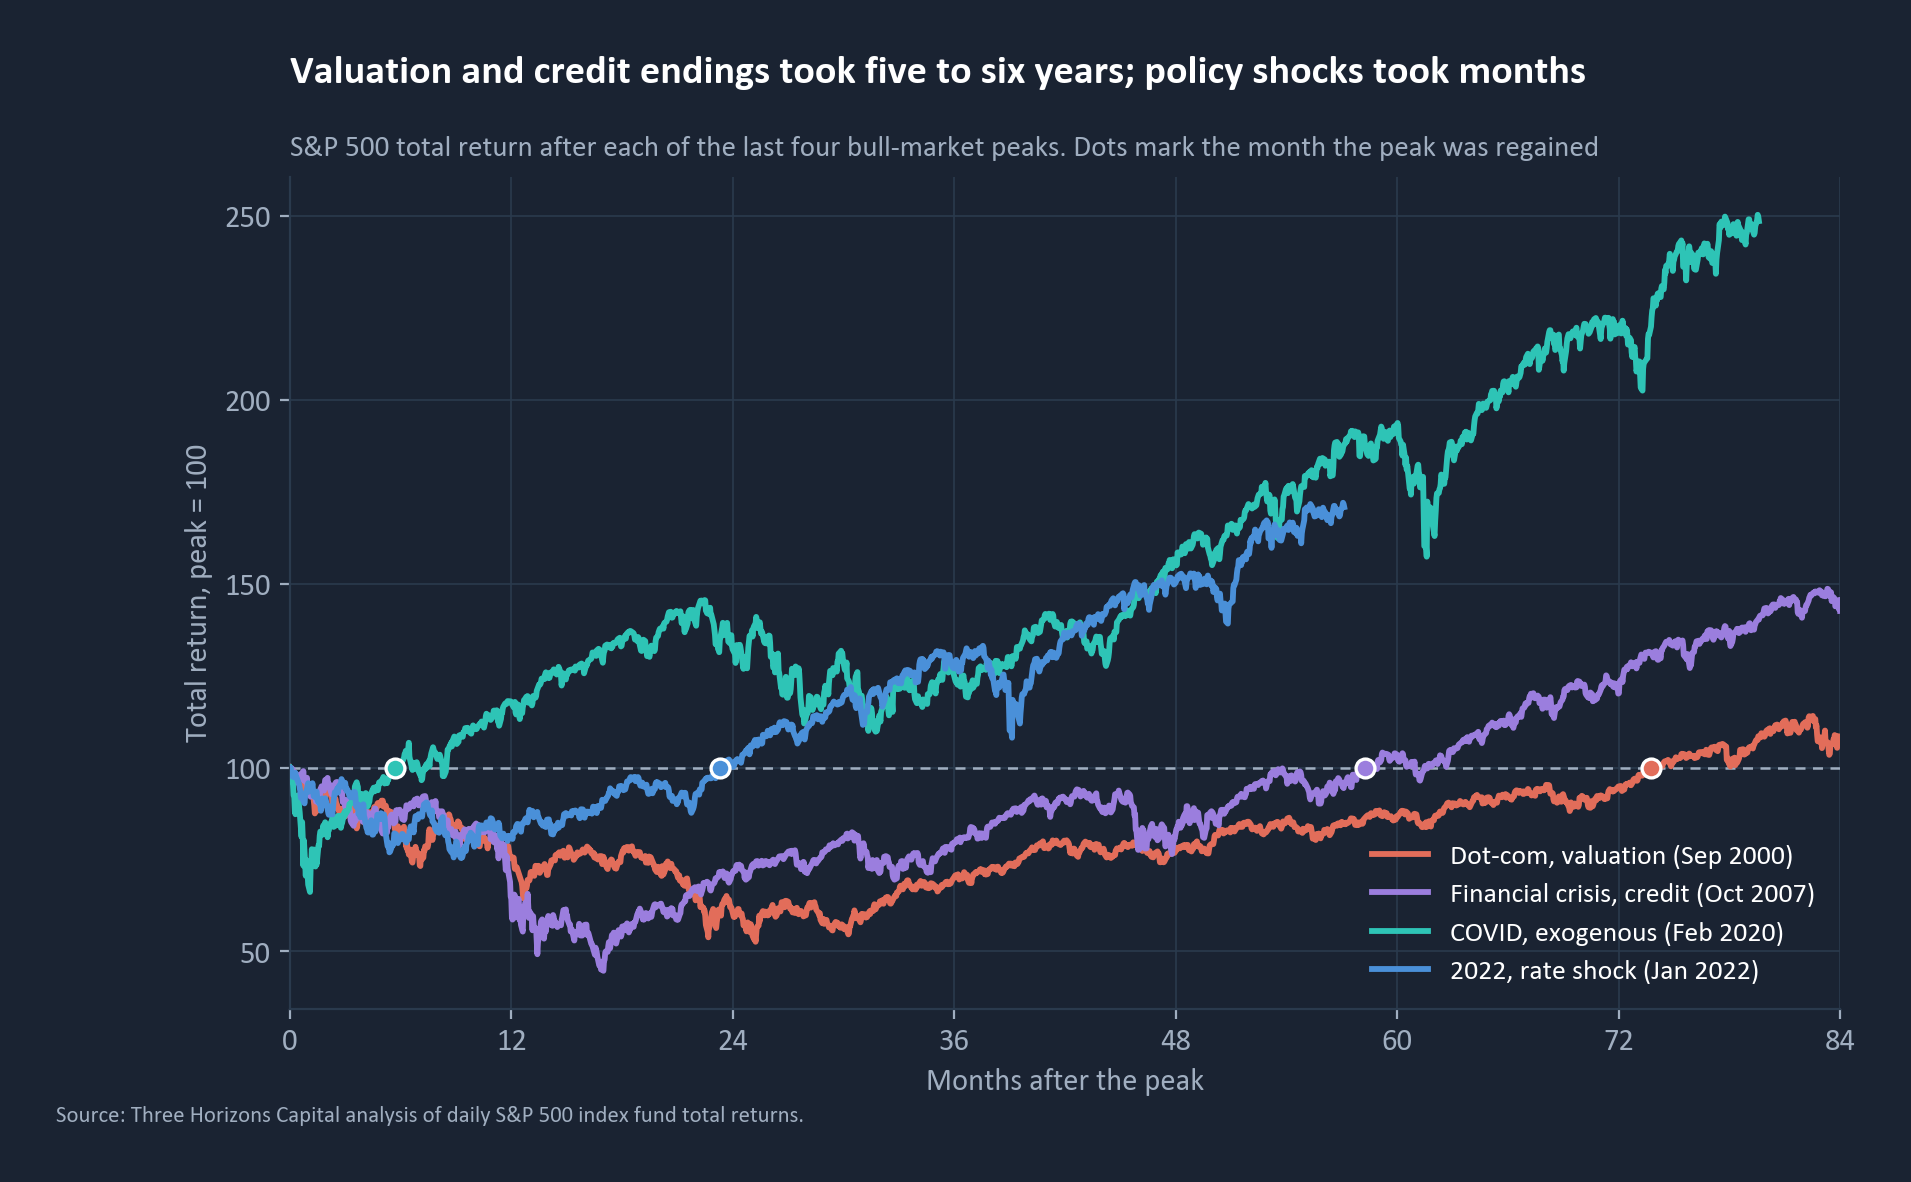
This cycle is concentrated like 2000 and runs on rates like 2022. It could end either way, which is the case for building for both.
What we would do with the book
In a standard 60/40 at today's index weights, the ten largest companies are 24.7% of the capital and 50.6% of the risk. We rebuilt it two ways: the ten largest capped at a quarter of the equity sleeve, and the bond sleeve split between intermediate Treasuries (the hedge when credit broke) and short Treasuries (the hedge when rates rose). Then we replayed both books through the last four endings, using each era's actual ten largest companies.
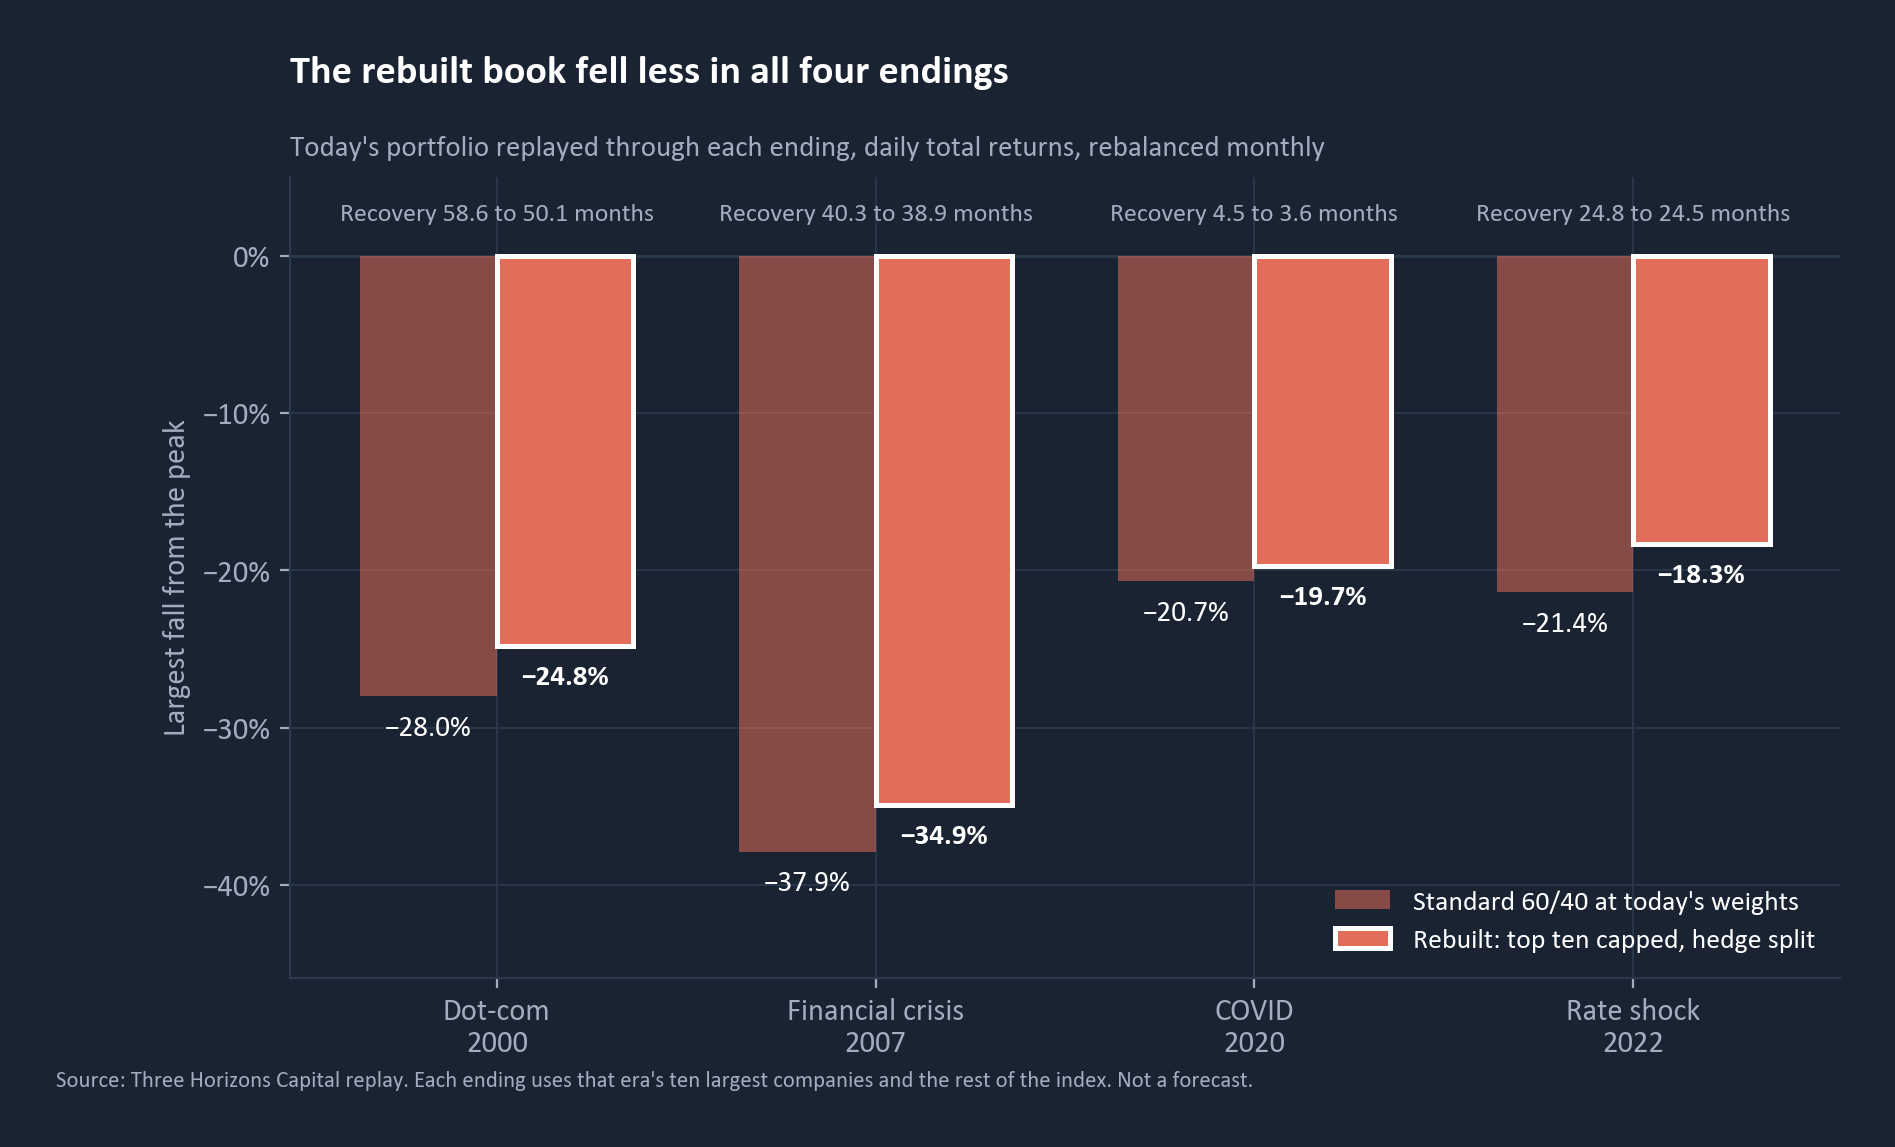
| Ending | Standard: largest fall | Rebuilt: largest fall | Standard: months to recover | Rebuilt: months to recover |
|---|---|---|---|---|
| Dot-com | −28.0% | −24.8% | 58.6 | 50.1 |
| Financial crisis | −37.9% | −34.9% | 40.3 | 38.9 |
| COVID | −20.7% | −19.7% | 4.5 | 3.6 |
| 2022 rate shock | −21.4% | −18.3% | 24.8 | 24.5 |
The rebuilt book fell less in all four endings, by about 3 points in the valuation, credit and rate endings and by 1.0 point in COVID. Through this bull it returned 72.0% against 73.6%, about 0.3 points a year. Both levers can be tuned. The full paper shows the cap at 15%, 20% and 25%, and which lever does the work in each ending. Read the full paper
So what for allocators
Stop asking when the bull ends. Ask which ending your portfolio is built for. Look through the index, set a concentration budget, build the bond sleeve for two endings, and plan in scenarios rather than dates.
Method: 20% rule on closing levels; drawdowns, recoveries and replays on daily total returns; concentration by full market value with each company counted once; risk from two years of daily return covariance. The replay applies today's weights to the past, rebalances monthly and charges no trading costs. A test of structure, not a forecast. Prepared by Three Horizons Capital. Not investment advice.
If this is useful
We build this kind of look-through and replay for portfolio teams who need to know which ending their book is built for. If that is the question in front of you, it is the work we do.
Read the full paper: the cap dial, the lever attribution, the full chronology and the method