Portfolio construction
Concentrated by Default
Reframing Mega Cap exposure in pension stress testing. A cap-weighted Mega Cap sleeve looks like ten large-cap holdings. Statistically, it behaves like one.
Three Horizons Capital, Research. Pension Stress-Testing Series. Basket baseline: Q2-2026 (2026-06-30) 13F filings; equity return series through 2026-09-18. September 2026.
73.0%
Of the Mega Cap basket's weight sits in seven AI-capex names: semiconductors and hyperscalers
80–91%
Of the basket's month-to-month return variance is explained by that one cluster
0.91 → 0.76
R² to the AI-capex factor once a broadened universe is equal-weighted, with both benchmarks still beaten
The finding in one line
A cap-weighted Mega Cap sleeve is not ten independent large-cap bets: it behaves, statistically, like one concentrated factor position. Size it deliberately, don't inherit its size by construction.
Most of a Mega Cap sleeve is one AI-capex bet wearing a diversification label
Nearly every diversified equity allocation carries US Mega Cap exposure. The more useful question for a pension stress test is not whether a plan holds it, but how much of that exposure is actually a concentrated semiconductor and hyperscaler bet wearing a large-cap-diversification label.
Using point-in-time (as-at month-end) basket construction and contemporaneous 13F filings, we find that the current 10-name US Mega Cap universe (NVIDIA, Alphabet, Apple, Microsoft, Amazon, Broadcom, Tesla, Meta, Berkshire Hathaway and AMD, the 10th name by market cap as of 2026-06-30 at $947.2bn, ahead of JPMorgan Chase at $877.1bn) carries 73.0% of its cap weight in an "AI-capex complex" of semiconductor and hyperscaler names. That complex explains 80–91% of the basket's month-to-month return variance, so risk concentration is materially higher than weight concentration alone suggests.
The same pattern shows up inside real institutional books. BlackRock, Norges Bank and T. Rowe Price each carry a substantial share of their entire equity book in this single cluster: 21.2%, 24.9% and roughly 25% respectively, with T. Rowe Price the most concentrated within its Mega Cap sleeve specifically, at 82.5%. Historically, "buy the ten biggest" was a detractor from 2000 to 2009 (a 17–25% forward win rate) and only became a reliable source of edge after 2015. Today's basket is more concentrated by industry than it was in that earlier detractor regime.
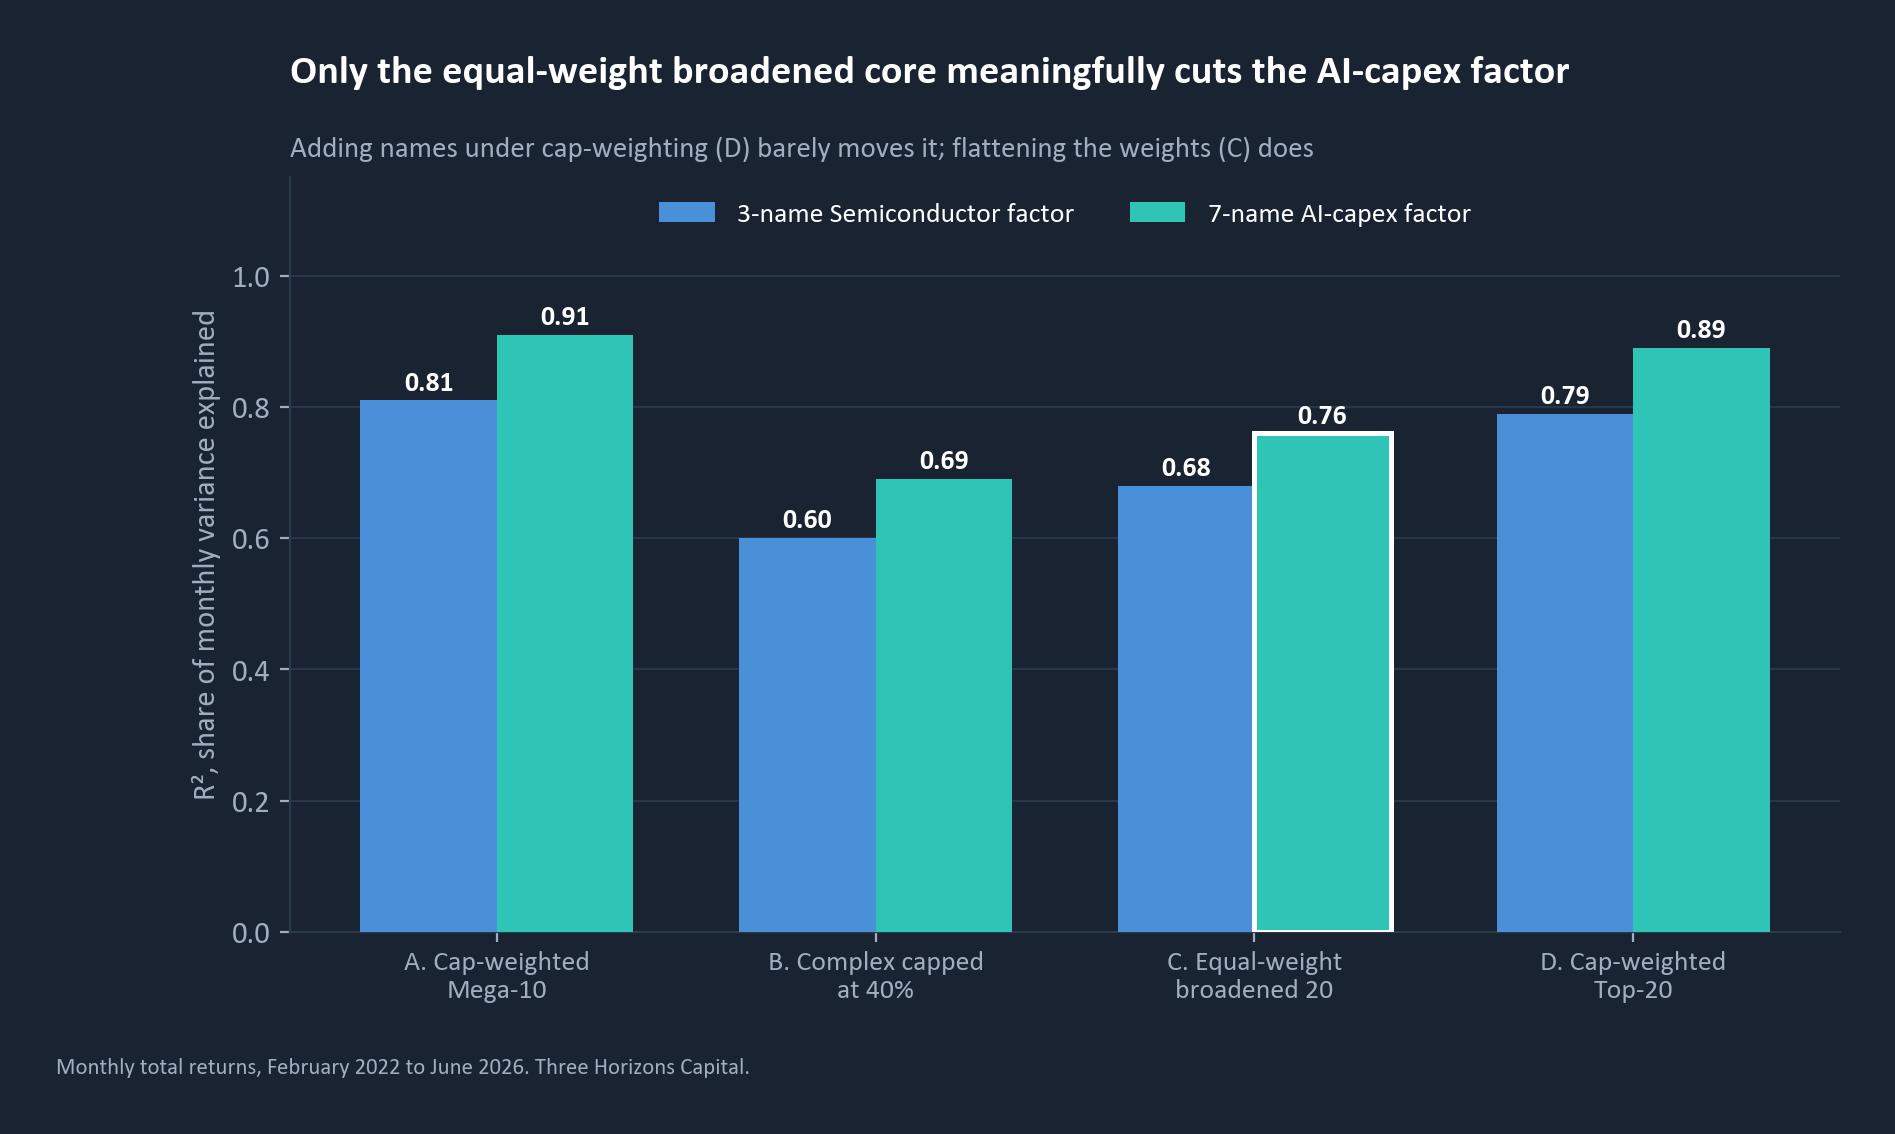
We test four diversification levers against this concentration. Simply adding more large-cap names does little if they remain cap-weighted: R² falls only from 0.91 to 0.89. Genuine risk reduction requires equal-weighting a broadened universe: R² falls to 0.76, and volatility and drawdown are each cut by about two-fifths. That approach still outperforms both SPY and QQQ on a risk-adjusted basis over the test window.
The recommendation is a core-satellite structure: an equal-weight broadened core, with the AI-capex tilt retained as an explicitly sized satellite rather than an unintentional byproduct of cap-weighting a "Mega Cap" sleeve.
Bottom line for the stress-testing desk
A cap-weighted Mega Cap sleeve is not ten independent large-cap bets: it behaves, statistically, like one concentrated factor position. Size it deliberately (section 05), don't inherit its size by construction.
How a “diversifier” became a factor bet
Mega Cap allocations are conventionally treated as a diversification anchor: a broad slice of the largest, most liquid names in the market. That framing rests on an assumption that hasn't held for the last five years, that the ten largest US companies span a genuinely diverse set of business models and risk drivers.
As of 2026-06-30, the 10th name by market capitalisation is Advanced Micro Devices (AMD, $947.2bn), not JPMorgan Chase ($877.1bn), after excluding three securities with data-integrity issues at that date, including Micron and Eli Lilly. That single substitution matters for what follows. It moves the basket's Financial Services exposure from two names (Berkshire Hathaway and JPMorgan) to one (Berkshire only), and shifts the basket's effective sector mix further toward Technology and Communication Services than a JPMorgan-inclusive version would suggest. Technology alone is roughly 57% of the 2026 basket, Communication Services roughly 23%, and Financial Services falls to roughly 4%.
The semiconductor tilt inside this basket is a recent phenomenon, not the endpoint of a multi-decade rotation. In 2000, Semiconductors represented roughly 13% of the Top-10 (Intel alone). The sector then disappeared entirely from the basket for fifteen years (2005–2020). It re-entered in 2021 via NVIDIA, Broadcom and AMD, and Semiconductors plus Internet Platforms first crossed a combined 50% of the basket in March 2024, peaking near 62% in June 2026 before easing to roughly 56% by September 2026.
Looked at across three related industries (Semiconductors, Internet Content & Information, and Software-Infrastructure), the current/2025 Top-10 concentration is roughly 59–60% of cap-weighted value, up from roughly 25% in 2000. That is a real and material increase in industry concentration. It is a five-year AI-capex phenomenon layered onto the Mega Cap basket, not a gradual multi-decade tech takeover, and that distinction matters for how a plan should stress-test it (section 05).
This dynamic is not confined to index-tracking or passive vehicles. Aggregating 13F sole-discretion holdings across all filers at 2026-06-30, the same AI-capex complex represents 74.5% of $6.76tn in aggregate Mega Cap exposure across the institutional universe. Inside individual large managers' books the concentration is comparable or higher: BlackRock (21.2% of its entire equity book), Norges Bank (24.9%) and T. Rowe Price (roughly 25% of its entire book, and 82.5% of its Mega Cap sleeve specifically) all carry this cluster as a meaningfully sized, largely unlabelled factor bet.
The rest of this paper decomposes that bet empirically, tests four ways to reduce it without giving up the return it has generated, and closes with a recommendation for how to size it deliberately inside a pension stress-testing framework.
Weight understates the concentration, and only flatter weights reduce it
Regressing the basket's monthly returns from January 2022 to September 2026 against a 3-name Semiconductor factor (NVDA, AVGO, AMD) and a 7-name AI-capex composite (adding GOOGL, MSFT, AMZN, META) shows that weight alone materially understates the concentration a plan is actually carrying:
| Cluster | Members | Weight | Semicon-factor correlation |
|---|---|---|---|
| Semiconductor core | NVDA, AVGO, AMD | 29.6% | 0.53 |
| Hyperscaler/AI-capex | GOOGL, MSFT, AMZN, META | 43.4% | 0.49–0.71 |
| Diversifiers | AAPL, TSLA, BRK-B | 27.0% | 0.11–0.49 |
| AI-capex complex (combined) | 7 names | 73.0% of weight | R²=0.80–0.91 of variance |
January 2022 to September 2026, monthly returns.
Over that window basket returns regress at R²=0.80 against the 3-name Semiconductor factor alone, rising to R²=0.91 against the full 7-name AI-capex composite. Roughly nine-tenths of the basket's month-to-month movement is explained by a single cluster carrying under three-quarters of its weight. BRK-B is the sole name with near-zero Semiconductor beta (0.05); AAPL (0.28) and TSLA (0.52) are only moderately diversifying.
We tested four levers against this concentration, benchmarked against both SPY and QQQ, using monthly total returns from February 2022 to June 2026 (53 months, position-level 2026-06-30 market caps). On this window the baseline's R² to the Semiconductor factor is 0.81.
| Portfolio | What it does | AI-capex weight | β / R², Semicon-3 | β / R², AI-capex-7 |
|---|---|---|---|---|
| A. Concentrated baseline (cap-wt Mega-10) | Reference point: the bet already being carried | 73.0% | 0.57 / 0.81 | 0.82 / 0.91 |
| B. Reduced-weight/factor-hedged: cap the complex at 40% of the sleeve within the existing 10 names | Simplest lever; no new exposure added | 40.0% | 0.45 / 0.60 | 0.65 / 0.69 |
| C. Equal-weight broadened: Mega-10 + 10 non-AI-capex large-caps (JPM, JNJ, MRK, KO, MA, PG, UNH, V, WMT, HD), 20 names @ 5% each | Adds genuinely new factor exposure; removes cap-weighting bias | 35.0% | 0.31 / 0.68 | 0.45 / 0.76 |
| D. Sector-diversified, cap-weighted Top-20: same 20 names, weighted by market cap | Tests whether "owning more large-caps" alone fixes it | 60.7% | 0.48 / 0.79 | 0.70 / 0.89 |
February 2022 to June 2026, 53 months.
Key finding
Broadening the universe only works if the weighting is also flattened. Portfolio D, adding ten well-known non-tech mega-caps under cap-weighting, barely moves the needle (R² to the AI-capex factor only falls from 0.91 to 0.89), because the AI-capex names remain individually 3–10x larger than the additions. Portfolio C, the same twenty names equal-weighted, cuts the AI-capex R² to 0.76 and the pure Semiconductor beta roughly in half (0.57→0.31). Portfolio B, reweighting only within the existing ten names with no new exposure, gets partway there (R²=0.69) but cannot go further, because AAPL and TSLA, its only real diversifiers, still carry meaningful Semiconductor beta themselves. A plan whose "Mega Cap diversification" consists of adding more large-cap names inside a cap-weighted vehicle is not meaningfully reducing this factor bet; it is relabelling it.
Equal-weighting a broader core cuts the risk and still beats both benchmarks
February 2022 to June 2026 (53 months), monthly total returns:
| Portfolio | Cum. return | CAGR | Ann. vol | Sharpe | Max DD | Corr. to SPY | Corr. to QQQ |
|---|---|---|---|---|---|---|---|
| A. Concentrated baseline | +215.9% | 29.7% | 28.3% | 1.07 | -35.2% | 0.82 | 0.91 |
| B. Reduced-weight/factor-hedged | +149.0% | 22.9% | 25.9% | 0.93 | -34.5% | 0.80 | 0.87 |
| C. Equal-weight broadened | +133.9% | 21.2% | 17.2% | 1.21 | -21.2% | 0.89 | 0.88 |
| D. Sector-diversified, cap-weighted | +193.6% | 27.6% | 24.4% | 1.13 | -30.0% | 0.85 | 0.92 |
| QQQ | +106.0% | 17.8% | 20.9% | 0.89 | -25.4% | 0.93 | 1.00 |
| SPY | +74.9% | 13.5% | 16.1% | 0.87 | -20.4% | 1.00 | 0.93 |
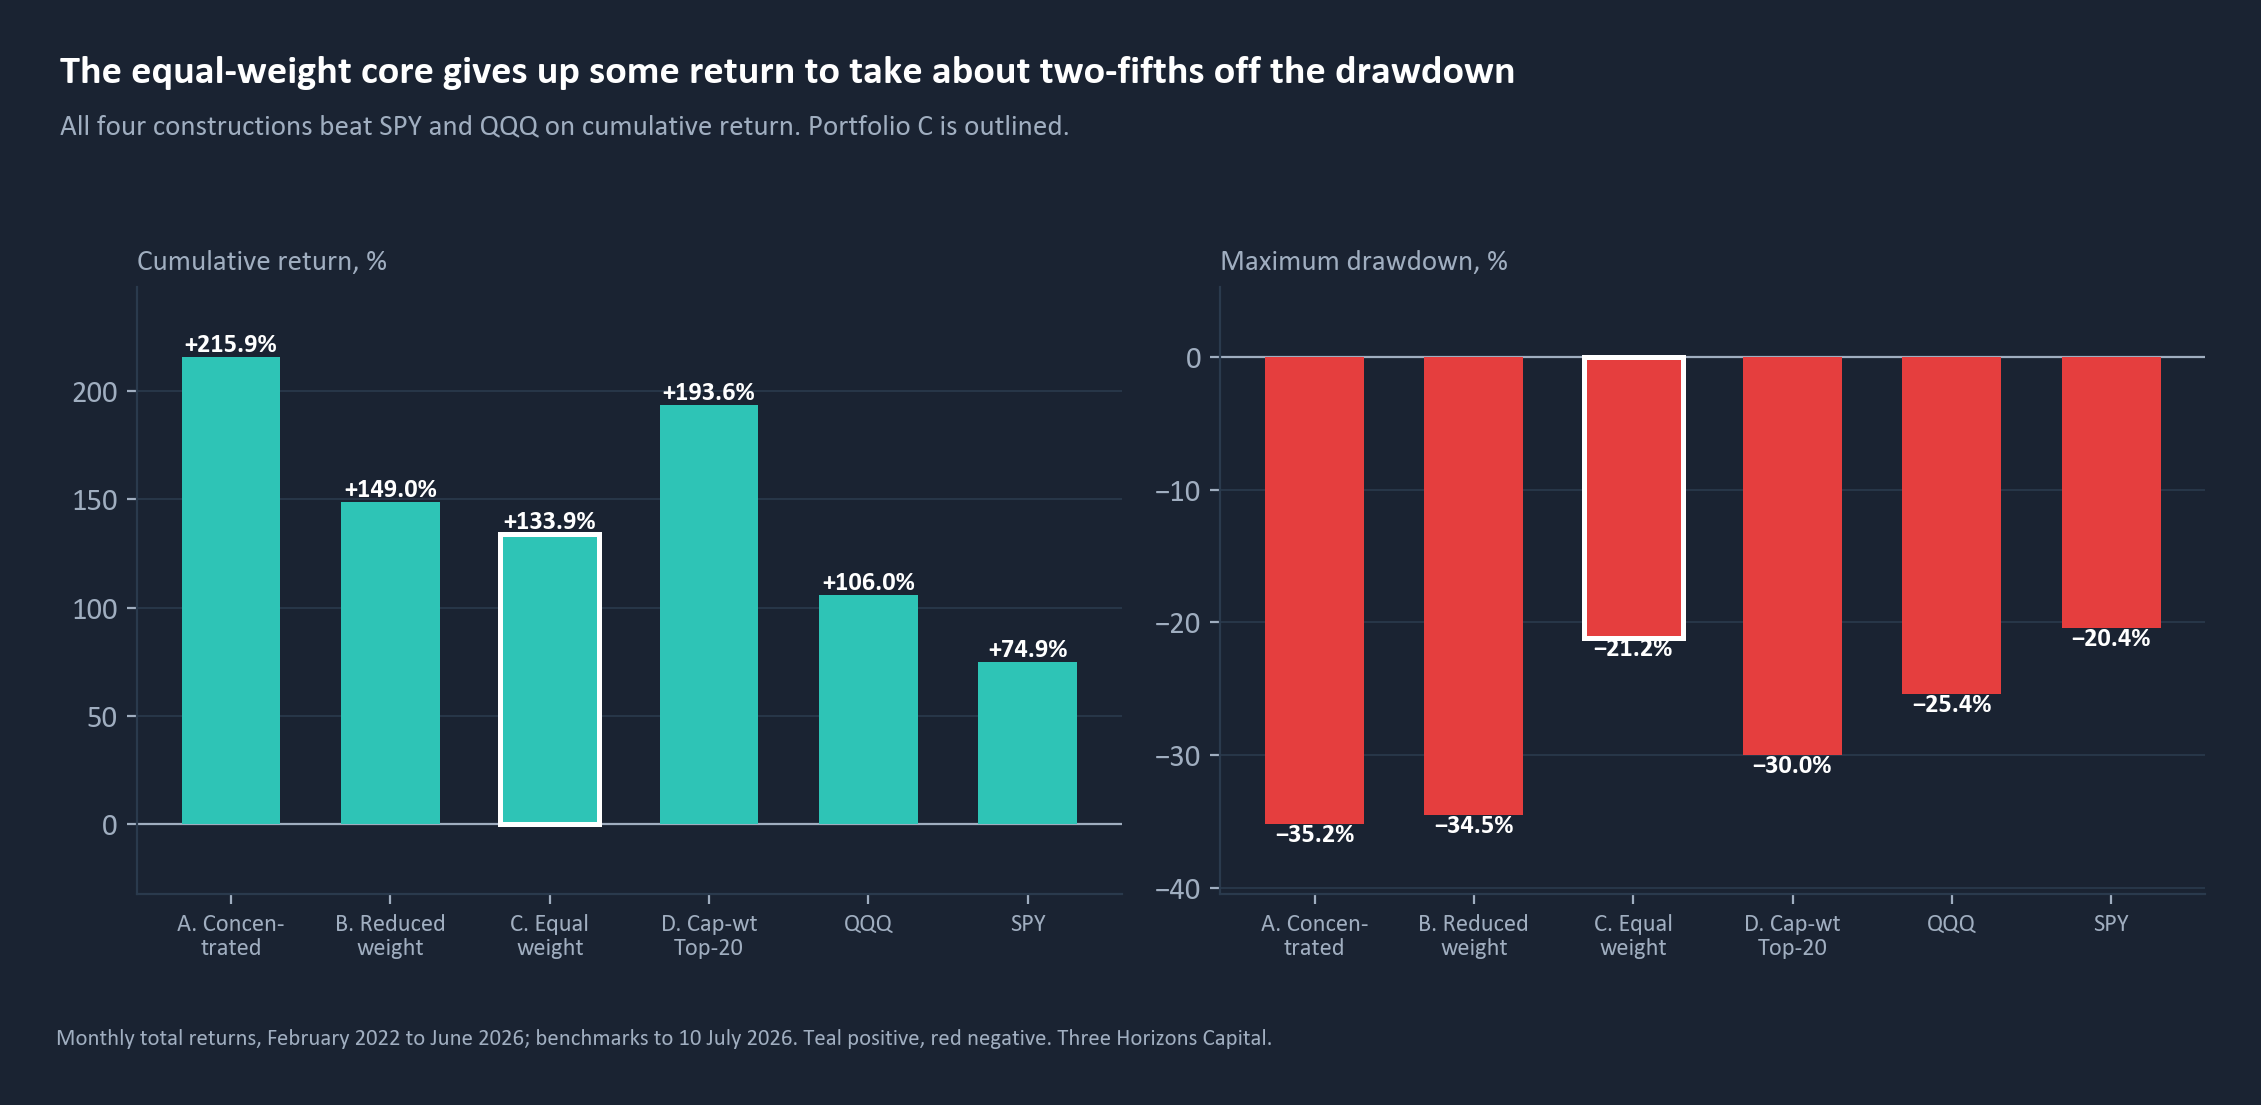
All four constructed portfolios beat both benchmarks on absolute return. Portfolio C is the risk-adjusted standout: the highest Sharpe of all six series, with volatility and drawdown each about two-fifths lower than the concentrated baseline, while still beating SPY by 59 points and QQQ by 28 points cumulatively. It is also less correlated to QQQ (0.88) than the concentrated baseline (0.91), despite both being nominally "Mega Cap" constructions.
The A/C blend dial. Rather than a binary A-or-C choice, blending the two portfolios in 25-point steps shows a monotonic, near-linear trade between return and risk:
| Blend (A/C) | CAGR | Ann. vol | Sharpe | Max DD | Approx. R² to AI-capex-7 |
|---|---|---|---|---|---|
| 100/0 (=A) | 30.0% | 28.1% | 1.08 | -35.2% | 0.91 |
| 75/25 | 28.0% | 25.0% | 1.12 | -30.7% | 0.88 |
| 60/40 | 26.7% | 23.3% | 1.14 | -28.7% | 0.85 |
| 50/50 | 25.8% | 22.1% | 1.16 | -27.4% | 0.84 |
| 40/60 | 25.0% | 21.0% | 1.17 | -26.2% | 0.82 |
| 25/75 | 23.6% | 19.4% | 1.19 | -24.4% | 0.80 |
| 0/100 (=C) | 21.2% | 17.0% | 1.22 | -21.2% | 0.76 |
Blend figures are computed on the blended return series. Their endpoints differ from the portfolio table above by up to 0.3 points (A: 30.0% against 29.7% CAGR; C: 17.0% against 17.2% volatility). The portfolio table is the reference for A and C.
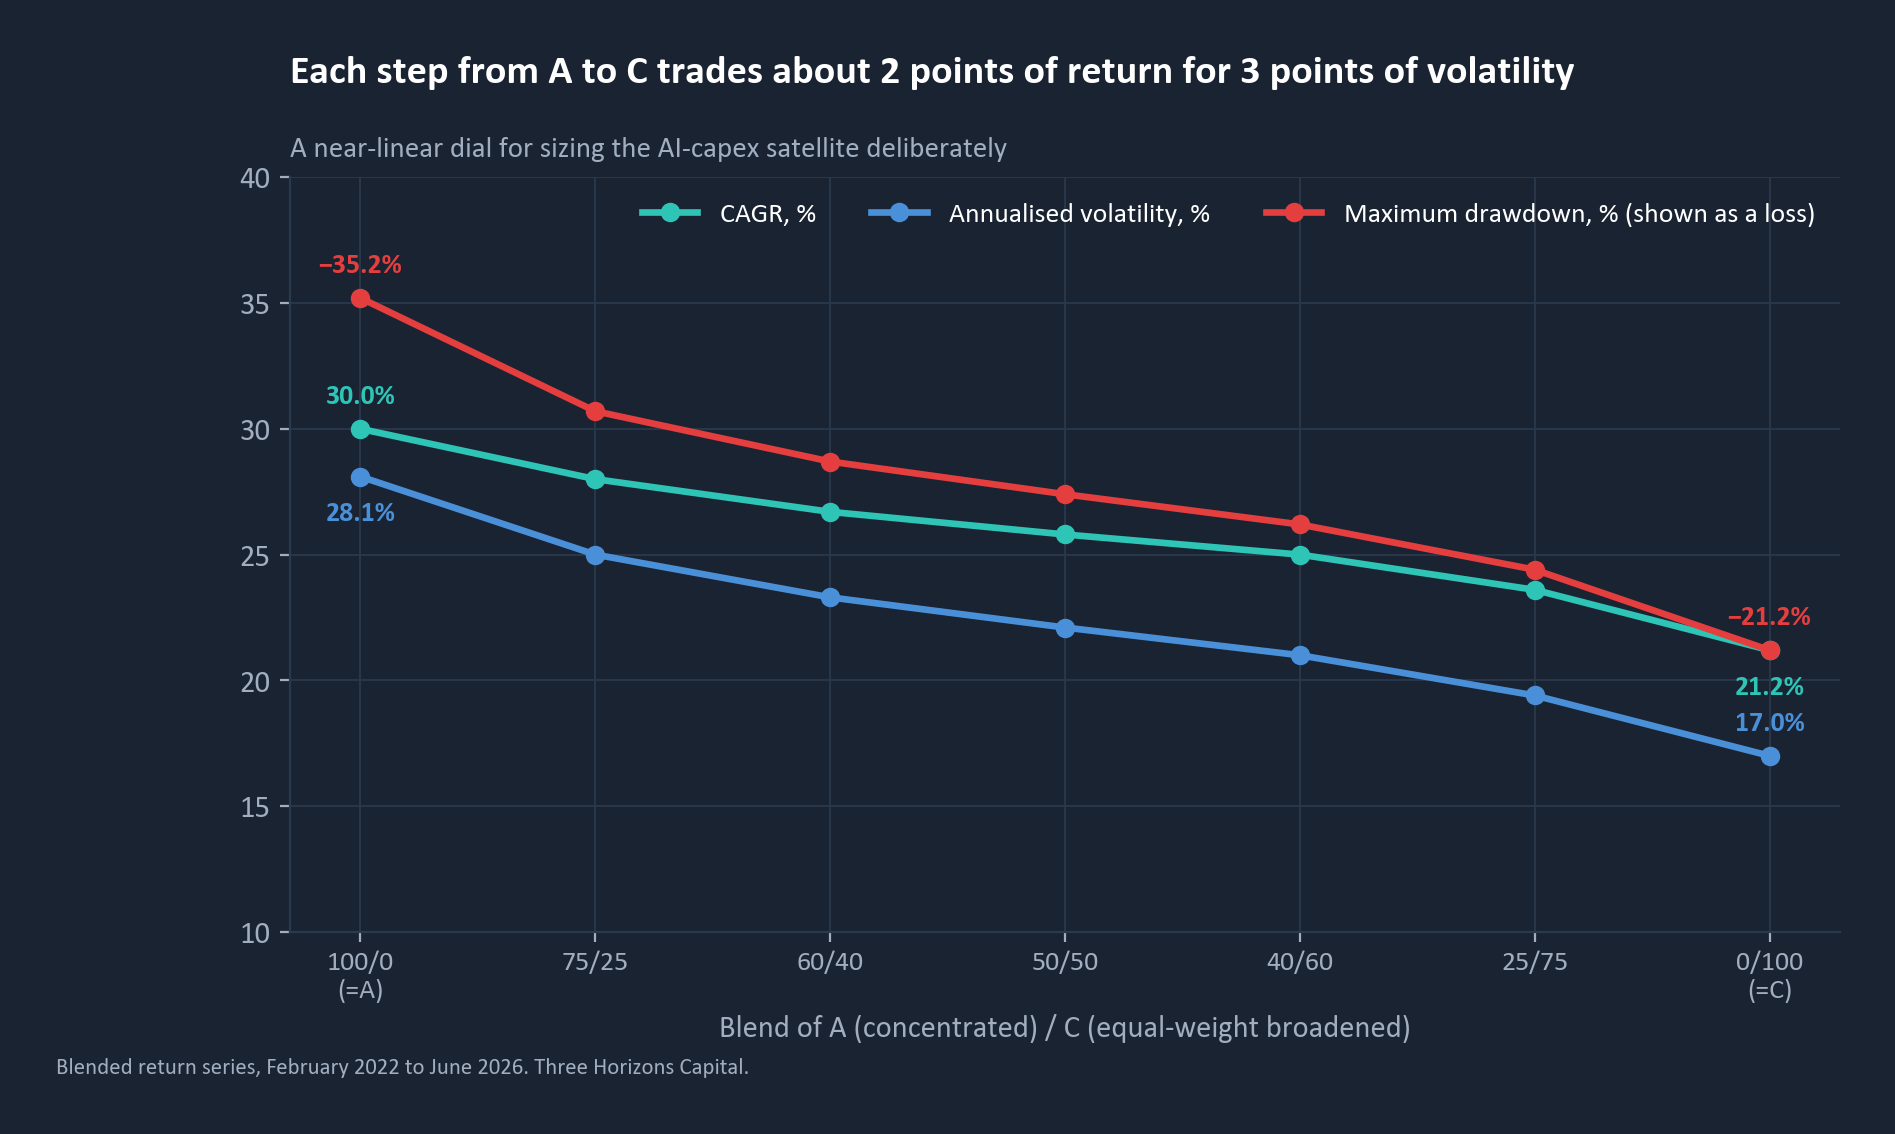
Every 25-point shift from A toward C buys 2.4 to 3.1 points of volatility reduction and 3.0 to 4.5 points of drawdown protection, at a cost of 2.0 to 2.4 points of CAGR: a fairly constant exchange rate, useful for sizing a satellite deliberately.
Run an equal-weight core and size the AI-capex satellite on purpose
Core sleeve = Portfolio C. Sharpe-optimal (1.21–1.22), it cuts volatility and drawdown by about two-fifths against the concentrated baseline, and it is the only lever that meaningfully reduces AI-capex R² (0.91→0.76) rather than relabelling the same bet across more names (Portfolio D only gets to 0.89).
Satellite = an explicitly sized AI-capex position, not an accidental one delivered by cap-weighting a ten-name sleeve. Two sizing rules:
Sharpe-maximising: full allocation to Portfolio C, giving up CAGR (21.2% against 29.7%).
Risk-budget-constrained: a 40/60 to 60/40 A/C blend caps AI-capex R² near 0.82–0.85, roughly where the raw 3-name Semiconductor factor alone already sits, while retaining more upside (25–27% CAGR) than pure C.
Within-basket reweighting (Portfolio B) is a partial answer at best. It only reduces AI-capex R² to 0.69, because AAPL and TSLA, its only real diversifiers, still carry meaningful Semiconductor beta (0.28 / 0.52) themselves. Genuine diversification needs names outside the mega-cap-tech complex, equal- not cap-weighted.
Stress-test tie-in. A plan holding cap-weighted "Mega Cap exposure" resembling BlackRock's, Norges Bank's or T. Rowe Price's books is carrying a sized AI-capex bet whether intended or not: roughly 21–25% of the entire equity book for the first two, and 82.5% of the Mega Cap sleeve for T. Rowe Price. The core-satellite structure converts that into a deliberately sized bet, stress-tested against the 2000–2009 regime (a 17–25% forward win rate for "buy the ten biggest"), when the basket was less concentrated by industry than it is today (roughly 25% against 59–60%), rather than against the 2015–2026 bull market the correlation structure above was measured on.
Final recommendation
Treat the current cap-weighted Mega Cap sleeve as two exposures, not one: a diversified equity core (Portfolio C) and a separately sized AI-capex satellite. Size the satellite to a risk budget defensible under a 2000–2009-style reversion scenario. A 40/60 to 60/40 A/C blend is a reasonable starting range, capping AI-capex R² near 0.82–0.85 while retaining most of the post-2015 upside, rather than accepting whatever satellite size a cap-weighted "Mega Cap" allocation delivers by construction. Revisit the split at least annually: the AI-capex complex's basket weight has moved materially within single years, and a static blend will drift back toward full concentration if left unmanaged.
What we measured, and how to read it
Basket composition. The 10th name by market cap on 2026-06-30 is AMD ($947.2bn), not JPMorgan Chase ($877.1bn), after excluding three securities for data-integrity issues. That is the basket used throughout this paper.
T. Rowe Price. Combined 13F sole-discretion Mega Cap exposure across both affiliated filers is $297.6bn (29.1% of its $1.021T combined book). The figure of roughly 25% of its entire book in sections 01, 02 and 05 applies the current AMD-inclusive basket to that combined figure. The two are measured differently and do not conflict.
Benchmarks. SPY and QQQ benchmark series run only to 2026-07-10, roughly 2.5 months short of the basket's 2026-09-18 endpoint. All section 04 comparisons are directional over the overlapping window, not a fully contemporaneous comparison.
Two windows. The cluster regression in section 03 uses January 2022 to September 2026; the portfolio tests in sections 03 and 04 use February 2022 to June 2026. That is why the baseline's Semiconductor R² reads 0.80 in the first and 0.81 in the second.
Industry concentration. Semiconductors, Internet Content & Information and Software-Infrastructure make up roughly 59–60% of current/2025 Top-10 cap-weighted value, up from roughly 25% in 2000: a real, material increase.
Share classes. Portfolios A–D use single-share-class market caps (GOOGL only), a deliberate, disclosed difference from the dual-share-class totals used in the manager-level 13F attribution in section 02.
Blend dial. The R² column is a linear interpolation between two measured endpoints (A and C), not a fresh regression at each blend weight.
Portfolio C substitutes Merck (MRK) for Eli Lilly (LLY) in the diversifier universe, consistent with LLY's exclusion from the Top-10 screen for data-integrity reasons.
Regimes. The full R²/correlation structure in sections 03 and 04 is estimated on a 2022–2026 bull-market-only window. The 2000–2009 regime statistics in sections 01, 02 and 05 are the closest available reversion proxy, not a direct backtest of the diversification levers themselves.
Data sources: 13F institutional holdings and filer master, as of the quarter ended 2026-06-30. Equity price, return and market-cap database (daily and monthly adjusted-close prices, market cap, security reference), as of 2026-09-18. S&P 500 historical index membership, daily snapshots, as of 2026-09-20. ETF benchmark return data (SPY and QQQ), weekly return series, as of 2026-07-10.
This paper is for information only. Prepared by Three Horizons Capital, it is research, not investment advice, and no security or fund is recommended. Past performance over a 2022–2026 window does not predict future returns. Figures are as at the dates stated.
If this is useful
We build this kind of test for pension plans and the managers who serve them, when a stress test needs to show what a sleeve actually is rather than what it is called. If the question in front of you is how much of your equity book is one bet, that is the work we do.
Important information
This paper is for information only. Prepared by Three Horizons Capital, it is research, not investment advice, and no security or fund is recommended. Past performance over a 2022–2026 window does not predict future returns. Figures are as at the dates stated.